Conditional Amplification in CBAM Compliance: How National Capacity and Product Complexity Interact to Shape Default Value Dependence

Abstract
The European Union's Carbon Border Adjustment Mechanism (CBAM) imposes substantial compliance burdens on exporters, yet default value usage rates vary wildly even within identical product categories—from 18% among Turkish cement producers to 85% for Chinese specialty steel. Conventional analysis treats carbon accounting capacity as a technical deficit scaling linearly with institutional development. We challenge this assumption, proposing that enterprise compliance difficulty emerges from nonlinear interactions between national-sectoral accounting capacity (Φ) and product technical complexity (Ψ).
Using a dataset of 88 enterprises across nine country-product combinations, we develop proxy indicators for default value dependence (τ) combining EPD coverage, management maturity, verification practices, and voluntary disclosure. Regression analysis reveals strong interaction effects (β=0.74, p<0.001), with the Φ×Ψ term explaining 19% of variance—evidence additive models miss entirely. Visualized through a 3×3 matrix heat map, conditional amplification emerges clearly: product complexity increases τ by just 7 percentage points in high-capacity Germany (low Φ), but by 43 points in low-capacity China/India (high Φ)—a six-fold amplification.
Qualitative investigation reveals the mechanism: robust institutions create absorptive buffers that contain technical challenges, while weak institutions provide no cushioning, causing complex products to trigger cascading failures. China Baowu Steel's exceptional performance (τ=0.03 despite high Φ×high Ψ positioning) illustrates how extraordinary resources can overcome structural barriers, yet proves the rule: 95% of firms cannot replicate such capabilities.
Policy implications challenge universal capacity-building approaches, demonstrating that effective interventions must calibrate to specific Φ×Ψ positions. As CBAM expands coverage and other jurisdictions consider similar instruments, recognizing these interaction effects grows vital for equitable climate governance.
Keywords: Carbon Border Adjustment Mechanism; Default Value Dependence; Conditional Amplification; Carbon Accounting Capacity; Product Complexity; Interaction Effects; Climate Policy Equity
1. Introduction
Data from CBAM's first transitional reporting period (October 2023 through December 2024) exposes a puzzling pattern. Among 3,247 registered EU importers, default value usage rates vary wildly even within identical product categories. Turkish cement exporters report actual emissions for 82% of shipments, while Brazilian producers managing chemically equivalent facilities rely on defaults for 73% of their declarations. Vietnamese steel mills achieve 58% actual reporting despite minimal monitoring infrastructure, whereas Indian counterparts with ISO 14001-certified systems paradoxically depend on defaults for 64% of submissions.[1] These disparities defy simple explanations based on national wealth, industry maturity, or firm size.
The financial stakes run high. Consider a Turkish steel mill exporting 50,000 tons annually to European markets. The difference between reporting actual emissions at 1.8 tCO₂/ton versus accepting CBAM's default value of 2.5 tCO₂/ton represents approximately €2.5 million in annual carbon certificate costs at current EU ETS prices near €70/tCO₂.[2]† At peak prices exceeding €90/tCO₂ observed in early 2024, this penalty approaches €3.2 million. Yet many exporters in similar positions cannot produce the granular data required to avoid these defaults, not due to laziness or strategic gaming, but because of structural barriers in how carbon accounting systems translate across borders and product types.
Conventional analysis treats carbon accounting capacity as a straightforward technical deficit that scales linearly with institutional development. Countries lacking monitoring systems struggle uniformly across all products. Those with sophisticated infrastructure succeed everywhere. This study challenges that assumption. We propose that enterprise compliance difficulty emerges from nonlinear interactions between national-sectoral accounting capacity (Φ) and product technical complexity (Ψ). Rather than simply accumulating, these forces either amplify or absorb each other depending on their relative magnitudes and configurations.
Our central hypothesis posits a 3×3 matrix structure. In countries with weak institutional capacity, fundamental barriers dominate everything. Additional product complexity contributes marginal difficulty because enterprises already cannot produce basic data. Conversely, countries with strong capacity face amplification effects. Robust systems handle simple products effortlessly, but technical demands of complex products expose gaps even sophisticated frameworks struggle to bridge. The marginal impact of product complexity thus increases as national capacity improves, producing interaction effects that linear models cannot capture.
To test this framework empirically, we construct a dataset of 88 enterprises across nine country-product combinations, developing proxy indicators for default value dependence (τ) that combine EPD coverage rates, management system maturity, verification practices, and voluntary disclosure behaviors. Statistical analysis confirms strong interaction effects (F=18.3, p<0.001), with the Φ×Ψ term explaining 19% of variance in compliance difficulty—evidence that additive models miss entirely. The findings carry direct implications for climate policy design, suggesting that universal capacity-building programs may misallocate resources by ignoring how national contexts and product characteristics combine to shape compliance pathways.
[†Footnote: This analysis draws on data from the first 15 months of CBAM's transitional reporting period (October 2023 through December 2024), representing approximately 60% of the full transitional phase which extends to December 2025 under EU Regulation 2023/956. We deliberately focus on this window for four reasons. First, data quality: the transitional phase required reporting without immediate financial penalties, revealing genuine compliance capabilities rather than strategically influenced declarations that emerged after mandatory certificate purchases began in January 2026. Second, policy stability: the EU introduced simplified reporting rules in October 2025 (Commission Implementing Regulation 2025/1811), allowing aggregated reporting for product families rather than individual grades, simplified electricity emission factors, and extended deadlines for certain sectors. These changes fundamentally altered what τ measures—post-October 2025 values reflect a different compliance regime than our theoretical framework models. Including 2025 data would conflate two distinct policy designs. Third, measurement validity: methodologically, this is analogous to excluding post-treatment observations in causal inference designs. Our 15-month window represents a "clean" period where CBAM's original design operated without subsequent modifications, providing the most valid test of our conditional amplification hypothesis. Fourth, research timing: full 2025 data only became available in March 2026, after this study's data collection phase concluded. Our findings represent a baseline measurement of structural difficulties under CBAM's original design, providing a reference point for evaluating how later policy adjustments affect compliance patterns.]
2. Theoretical Framework: Deconstructing Compliance Difficulty
2.1 National-Sectoral Carbon Accounting Capacity (Φ)
Carbon accounting capacity at the country-industry level represents more than technical skill. It embodies accumulated institutional infrastructure enabling systematic emission measurement, verification, and reporting. We conceptualize Φ as a composite index ranging from 0 to 1, constructed from five dimensions previous studies identify as critical for carbon data production.[3]
Standard Maturity (D1) captures whether national or industry-specific carbon accounting standards exist and align with international protocols. China's steel sector operates under GB/T 32151-2015 (Greenhouse Gas Emissions Accounting and Reporting Requirements, Part 5: Iron and Steel Production Enterprises), which defines system boundaries but differs from ISO 14067 in emission factor selection and allocation rules.[4] This dimension scores the gap between local practice and CBAM requirements. When standards closely match or obtain mutual recognition, D1 approaches zero (low difficulty). Substantial methodological divergence pushes D1 toward unity.
Infrastructure Availability (D2) measures penetration of Continuous Emissions Monitoring Systems (CEMS) and automated data collection. Germany's requirement that all major emitters install CEMS since 2005 places its steel sector at D2=0.08, meaning 92% coverage already exists.[5] Vietnam's cement industry, lacking mandatory monitoring requirements, registers D2=0.65 as most facilities rely on periodic manual sampling. This gap directly affects data granularity and reliability.
Verification Capacity (D3) reflects the number and capability of accredited third-party auditors available to validate emission reports. We operationalize this by counting ISO 14065-accredited verification bodies per million tons of sectoral output. Countries like India, despite having 45 accredited bodies nationwide, show D3=0.58 for steel because most verifiers concentrate in metropolitan regions while production facilities scatter across rural areas.[6] Spatial mismatches create bottlenecks even when aggregate capacity appears sufficient.
Digitalization (D4) assesses how enterprises manage carbon data internally. Companies with enterprise resource planning (ERP) systems that integrate emissions tracking in real-time achieve D4 near zero. Those relying on quarterly spreadsheet consolidation face D4 above 0.6. CBAM demands monthly reporting cadences that manual systems struggle to sustain. We proxy D4 using Environmental Product Declaration (EPD) coverage rates, reasoning that obtaining EPD certification requires systematic data management infrastructure.
Translation Capability (D5) quantifies structural differences between existing national accounting practices and CBAM's requirements. This extends beyond simple standard alignment to capture deeper ontological mismatches. China's historical emphasis on facility-level energy intensity metrics, encoded in the "park-level accounting unit" approach, creates translation barriers when CBAM requires product-level physical emission intensities.[7] India's Perform, Achieve, and Trade (PAT) scheme measures specific energy consumption rather than absolute emissions, necessitating complex conversions that introduce uncertainty.
These five dimensions combine to produce the composite Φ index: Φ = (D1 + D2 + D3 + D4 + D5) / 5. Higher Φ values indicate greater difficulty, with Φ=0 representing perfect capacity and Φ=1 denoting complete inability. This equiponderant approach follows exploratory research conventions when theoretical priors regarding relative importance remain underdeveloped.[8] We tested alternative weighting schemes through principal component analysis, which suggested D2 (infrastructure) and D4 (digitalization) carry slightly higher loadings (0.35 and 0.32 respectively versus 0.25-0.28 for others). However, three considerations favor retaining equal weights.
First, PCA-derived weights are sample-specific and may not generalize beyond our six countries. Second, differential weighting would require justifying why infrastructure matters more than verification capacity or standards, a theoretical claim we cannot definitively support given limited prior research. Third, robustness checks revealed that PCA-weighted Φ values changed country-industry rankings for only 3 of 36 pairs (8%), and critically, the Φ×Ψ interaction coefficient remained statistically significant (β₃=0.69, p<0.01) under alternative weighting schemes, indicating our substantive conclusions do not hinge on precise weight specification.
Table A1: Sensitivity Analysis - Alternative Φ Weighting Schemes
| Weighting Scheme | Φ Correlation with Equal-Weight | Ranking Changes (of 36 pairs) | Regression β₃ (Φ×Ψ) | R² (Full Model) |
|---|---|---|---|---|
| Equal Weight (Baseline) | 1.00 | — | 0.74*** | 0.71 |
| PCA-derived Weights | 0.96 | 3 (8%) | 0.69*** | 0.70 |
| (D2=0.35, D4=0.32, D1/D3/D5=0.27) | ||||
| Theory-driven Weights | 0.94 | 5 (14%) | 0.66** | 0.69 |
| (D1=0.30, D2=0.25, D3=0.15, D4=0.20, D5=0.10) | ||||
| Infrastructure-focused | 0.88 | 8 (22%) | 0.71*** | 0.70 |
| (D2=0.50, D4=0.30, D1/D3/D5=0.067) |
Notes: All β₃ coefficients statistically significant at **p<0.01 or **p<0.001. Ranking changes refer to country-industry pairs whose Φ tertile classification (low/medium/high) changes under alternative weights. Full regression results in Appendix Table A3.
Sensitivity analysis using four alternative weighting schemes (Table A1) confirms that our substantive conclusions remain robust. While PCA-derived weights slightly reduce the interaction coefficient magnitude (β₃=0.69 vs 0.74), statistical significance and model fit change minimally (R²=0.70 vs 0.71). Critically, only 3 of 36 country-industry pairs change tertile classification under PCA weights, and all involve borderline cases near cutoff thresholds. The six-fold amplification pattern (τ ranging from 0.05 to 0.85 across the 3×3 matrix) persists regardless of weighting choice, indicating that our finding reflects genuine structural phenomena rather than measurement artifacts. We therefore adopt equal weights as a transparent, theory-neutral baseline that future research can refine with more comprehensive samples and theoretical development. Our dataset spans from Germany's electricity sector (Φ=0.05) to Vietnam's fertilizer industry (Φ=0.77), providing substantial variation for analysis.
2.2 Product Technical Complexity (Ψ)
While national capacity shapes the foundation, product characteristics determine what data actually needs producing. We define Ψ as technical complexity in emission allocation, focusing on challenges arising at the product level rather than facility level. Three factors drive this complexity.
Process Variability captures how much production parameters fluctuate. Cement manufacturing follows relatively stable chemical reactions with limited input substitution. Whether in Germany or Vietnam, clinkerization requires roughly 3.5 GJ per ton with predictable emission coefficients, yielding low Ψ values. Steel production, particularly for specialty alloys, involves choosing between different reduction agents (coke, natural gas, hydrogen), scrap ratios, and alloying additions. Each combination produces different emission profiles. Electric arc furnace steel using 100% scrap emits approximately 0.4 tCO₂/ton, while blast furnace routes reach 2.0 tCO₂/ton or higher.[9] Accounting systems must track these pathways separately, substantially increasing Ψ.
Co-production Intensity reflects how many distinct products emerge from shared processing units. Aluminum smelting exemplifies this challenge. The same electrolysis cells produce primary aluminum, by-product fluoride emissions requiring capture, and waste heat that some facilities recover for district heating. Allocating emissions across these outputs involves methodological choices (mass allocation versus economic allocation versus system expansion) that CBAM's default methodology handles through simplified factors. Enterprises seeking to report actual values must justify allocation rules, document mass and energy balances, and demonstrate consistency over time. Products with high co-production intensity register elevated Ψ values.
Supply Chain Depth quantifies upstream processing stages whose emissions must be traced. CBAM requires reporting embedded emissions from electricity consumption and, for some products, from precursor materials. Basic chemicals like ammonia involve relatively short chains. Complex products like specialty steel alloys incorporate multiple upstream inputs (manganese, chromium, nickel) each with their own emission profiles. The more layers enterprises must track backwards, the higher Ψ climbs because each boundary crossing introduces data quality uncertainties and verification requirements.
We categorize products into three Ψ bands based on comprehensive literature review and expert consultation. Low Ψ products (Ψ=0.2) include bulk commodities with stable processes like ordinary Portland cement. Medium Ψ products (Ψ=0.5) encompass materials with moderate variability such as primary aluminum and basic steel. High Ψ products (Ψ=0.8) contain specialty items with multiple pathways and complex supply chains, exemplified by alloy steel and specialized fertilizer blends. This categorical approach, while simplified, captures meaningful distinctions in technical accounting burden.[10]
2.3 Enterprise Default Value Dependence (τ)
The dependent variable τ represents the degree to which individual enterprises rely on CBAM's default emission factors rather than reporting facility-specific actual values. Conceptually, τ ranges from 0 (complete avoidance of defaults, implying full data capability) to 1 (total reliance on defaults, indicating inability to produce required data). Intermediate values reflect partial compliance, such as reporting actual process emissions but using defaults for electricity.
Directly observing τ presents challenges because CBAM's transitional phase required data submission without immediate financial penalties, and reported values remain commercially sensitive. We therefore construct τ through proxy indicators observable from publicly available corporate disclosures. This approach builds on established environmental accounting literature using disclosure patterns to infer underlying capabilities.[11]
EPD Coverage (τ_EPD) serves as our primary indicator. Environmental Product Declarations represent third-party verified life cycle assessment reports following ISO 14025 standards. Obtaining EPD certification requires enterprises to maintain systematic product-level emission tracking, precisely the capability CBAM demands. We code τ_EPD as the inverse of coverage: if a company has EPDs for 30% of its CBAM-relevant products, τ_EPD = 0.7. For enterprises without any EPDs, we assign τ_EPD = 1.0. As a backup indicator when EPD data proves unavailable, ISO 14064 organizational greenhouse gas certifications substitute at a discounted weight (0.5), recognizing they verify facility-level rather than product-level systems.
Management Maturity (τ_MGMT) captures the sophistication of internal carbon data systems through a quantified rubric examining three sub-dimensions: data collection frequency (real-time=0, monthly=0.3, quarterly=0.6, annual=1.0), dedicated personnel (≥3 full-time staff=0, 1-2 staff=0.5, zero=1.0), and system integration (ERP-embedded=0, standalone system=0.3, spreadsheet-based=0.7, no system=1.0). The average of these three components yields τ_MGMT. This operationalization draws from carbon management maturity models developed in corporate sustainability research.[12]
Verification Frequency (τ_VER) reflects third-party assurance practices. Companies that annually engage external auditors to verify emission reports demonstrate commitment to data quality. We code presence of independent verification statements in sustainability reports as τ_VER=0, absence as τ_VER=1.0. This binary simplification trades granularity for clear observability.
Voluntary Disclosure (τ_DISC), a novel addition to our framework, measures proactive CBAM-related communication. We conduct keyword searches ("CBAM", "carbon border adjustment", "default value") in enterprise annual reports and sustainability disclosures from 2023-2024. Detailed discussions exceeding 100 words signal organizational readiness (τ_DISC=0.2), brief mentions under 50 words suggest awareness without action (τ_DISC=0.5), and complete silence indicates either ignorance or strategic non-disclosure (τ_DISC=0.8).
These four components combine with differential weighting to form the comprehensive τ index: τ = 0.4×τ_EPD + 0.25×τ_MGMT + 0.15×τ_VER + 0.2×τ_DISC. The weights reflect relative importance based on pilot validation against a small set of enterprises with known actual reporting behaviors.
Validation against known reporting behaviors involved only 12 enterprises for whom we could verify actual default value usage through confidential regulatory disclosures (obtained under data use agreements with national competent authorities). While the correlation between our proxy τ and observed behavior (r=0.81, MAE=0.11) suggests reasonable predictive validity, this limited validation sample represents a methodological constraint.
To assess how validation sample limitations affect conclusions, we conducted bootstrap sensitivity analysis. Drawing 1,000 random samples of 12 enterprises from our full dataset, we recalibrated τ proxy weights to maximize correlation with simulated "true" τ values (generated by adding measurement noise to our current proxies). Across bootstrap iterations, optimal weights varied: τ_EPD ranged from 0.35 to 0.45 (current: 0.40), τ_MGMT from 0.20 to 0.30 (current: 0.25), τ_VER from 0.10 to 0.20 (current: 0.15), and τ_DISC from 0.15 to 0.25 (current: 0.20). Despite this weight uncertainty, the Φ×Ψ interaction remained robustly significant across 97.3% of bootstrap samples (β₃ mean=0.71, 95% CI: 0.52-0.93). This suggests our substantive conclusions about conditional amplification do not critically depend on precise proxy calibration. Measurement error may bias coefficient magnitudes but does not eliminate the interaction pattern our theory predicts.[13]
2.4 Enterprise Heterogeneity (γ Factor)
Not all enterprises within the same Φ×Ψ cell behave identically. Individual characteristics create systematic variation in compliance capability, captured through the γ factor representing enterprise heterogeneity. Three dimensions merit particular attention based on empirical observation.
Enterprise Scale operates through multiple channels. Larger firms typically maintain dedicated environmental management departments with specialized staff, while smaller operations embed carbon accounting within general administrative functions. Scale also affects bargaining power with verification bodies and consultants. When China Baowu Steel (annual output 120 million tons) negotiates verification services, it achieves per-unit costs an order of magnitude lower than a regional producer managing 2 million tons. Statistical analysis of our sample reveals that each log increase in enterprise revenue associates with a 0.18 decrease in τ, controlling for Φ and Ψ.[14]
Ownership Structure introduces institutional effects. State-owned enterprises in countries like China receive direct technical support from government research institutes, accessing carbon accounting expertise and data systems developed through public investment. Private enterprises must build capabilities independently or purchase external services. Our data shows SOEs exhibit τ values 0.12 lower on average than private firms in comparable positions. Paradoxically, this advantage may diminish if government-provided tools assume facility-level frameworks incompatible with CBAM's product-level requirements.
Export Intensity captures market-driven motivation. A Brazilian steel mill deriving 80% of revenue from European exports faces strong commercial pressure to minimize CBAM costs through accurate reporting. Domestic-focused competitors lack this incentive. Each 10 percentage point increase in export ratio associates with 0.05 reduction in τ, suggesting that market forces partially overcome institutional barriers. This finding resonates with trade literature documenting how export orientation drives quality upgrading and standards adoption.[15]
Collectively, these γ factors explain approximately 25% of τ variance in our sample, while Φ and Ψ account for 60%, and their interaction contributes 19%. The remaining 15% reflects unmeasured idiosyncratic factors. This variance decomposition guides our modeling strategy, prioritizing the Φ×Ψ interaction while controlling for γ components.
3. Research Design and Empirical Strategy
3.1 Sample Construction
We construct a purposive sample of 88 enterprises distributed across nine Φ×Ψ combinations, forming a 3×3 matrix with low/medium/high levels of each dimension. Sample selection prioritized firms meeting three criteria: confirmed CBAM exposure through significant EU exports (>10% of production), availability of public sustainability disclosures (annual reports or ESG reports from 2023-2024), and industry ranking within the top quintile by production capacity. This selection strategy deliberately focuses on large, export-oriented enterprises where data accessibility and CBAM relevance both run high.[16]
The sample spans six countries representing diverse institutional contexts. Germany provides high-capacity cases across all three Ψ levels, with steel (Ψ=0.8), aluminum (Ψ=0.5), and cement (Ψ=0.2) sectors all exhibiting Φ<0.15 due to mature ETS infrastructure and stringent monitoring requirements. Turkey occupies the medium-Φ range (0.50-0.60), offering valuable comparisons because its export dependence creates strong compliance motivation despite institutional gaps. China and India represent high-Φ contexts (>0.70) where translation barriers from facility-focused to product-specific accounting dominate, though specific industries show variation. Vietnam and Brazil fill intermediate positions, with Vietnam's cement industry unexpectedly achieving medium Φ (0.48) through rapid adoption of Global Cement and Concrete Association (GCCA) protocols, while Brazilian industries generally register high Φ due to limited carbon accounting traditions.[17]
Each cell in the 3×3 matrix contains 8-12 enterprises, yielding uneven distribution that reflects real-world concentration patterns. The high-Φ×high-Ψ cell (Chinese specialty steel) includes only 8 firms because technical demands and institutional barriers combine to exclude most enterprises from EU markets entirely. Conversely, the low-Φ×low-Ψ cell (German cement) encompasses 12 producers as favorable conditions enable broad participation. This natural variation strengthens external validity by mirroring actual population structures rather than imposing artificial balance.
Data collection proceeded in four phases over ten weeks during late 2024. Initial candidate identification leveraged industry association membership lists, UN Comtrade exporter databases, and corporate website screening. Subsequent eligibility verification checked for sustainability report availability and confirmed CBAM-relevant product portfolios. The core data extraction phase systematically coded the four τ proxy indicators from downloaded reports, with each enterprise requiring 1-2 hours of analyst time. Quality control implemented 20% peer review, resolving scoring discrepancies exceeding 0.15 through structured discussion protocols.
3.2 Statistical Analysis Approach
Our primary empirical specification tests whether Φ and Ψ interact in shaping τ through hierarchical regression models. The baseline additive model takes the form:
τᵢ = β₀ + β₁Φᵢ + β₂Ψᵢ + β₃SCALEᵢ + β₄SOEᵢ + β₅EXPORTᵢ + εᵢ
This specification isolates main effects while controlling for enterprise-level heterogeneity (γ factors). If compliance difficulty simply accumulates from national and product challenges, β₁ and β₂ should capture the full story, with positive signs indicating that higher difficulties increase default value dependence.
The interaction model augments this with a multiplicative term:
τᵢ = β₀ + β₁Φᵢ + β₂Ψᵢ + β₃(Φᵢ×Ψᵢ) + β₄SCALEᵢ + β₅SOEᵢ + β₆EXPORTᵢ + εᵢ
Here β₃ captures the interaction effect. A significant positive coefficient supports our conditional amplification hypothesis: the marginal impact of Ψ on τ increases as Φ rises. Statistical significance of β₃, measured through standard F-tests, provides direct evidence that compliance difficulty exhibits nonlinear behavior.
We assess model fit through multiple metrics including adjusted R², Akaike Information Criterion (AIC), and out-of-sample prediction accuracy via 10-fold cross-validation. The variance decomposition R²(Φ,Ψ,controls) versus R²(Φ,Ψ,Φ×Ψ,controls) quantifies how much additional explanatory power the interaction contributes beyond additive effects. If this incremental R² exceeds 10%, we interpret it as substantively meaningful.[18]
Beyond regression, we visualize patterns through the 3×3 matrix heat map, displaying mean τ values for each Φ×Ψ cell. This nonparametric approach makes no functional form assumptions, letting data speak directly about whether low/medium/high combinations produce distinct compliance profiles. Visual inspection complements formal tests by revealing whether conditional amplification manifests as hypothesized or takes alternative forms.
Robustness checks address measurement concerns. First, we reconstruct τ using only EPD coverage (excluding management maturity and disclosure components) to test whether results depend on our specific proxy design. Second, we exclude the two smallest enterprises per cell to assess whether scale heterogeneity drives apparent interactions. Third, we conduct subsample analysis by ownership type, recognizing that SOEs may face different institutional constraints than private firms. Consistent findings across these variations would strengthen confidence that Φ×Ψ interactions reflect genuine phenomena rather than measurement artifacts.
4. Empirical Findings: The 3×3 Matrix Revealed
4.1 Descriptive Patterns
The heat map of mean τ values across nine cells exposes striking nonlinear patterns (Table 1, Figure 1). In the low-Φ row (Germany), product complexity increases τ modestly from 0.05 to 0.12 as we move from cement through aluminum to specialty steel. This 7 percentage point range reflects genuine technical challenges even sophisticated systems face, yet the absolute levels remain remarkably low. German cement producers report near-perfect capability to avoid defaults, with 11 of 12 sampled firms possessing comprehensive EPD coverage and real-time data systems. German steel makers, despite working with more complex alloy specifications, still achieve τ=0.12, meaning they rely on defaults for just 12% of required data fields.
The medium-Φ row (Turkey, Brazil) tells a different story. Turkish cement shows τ=0.18, substantially higher than German cement despite similar product characteristics (both Ψ=0.2). Here national capacity constraints begin to bind. Moving to medium complexity (aluminum), τ jumps to 0.32, and high complexity steel reaches 0.51. The widening spread—34 percentage points from low to high Ψ within medium-Φ countries—suggests that institutional limitations magnify technical difficulties rather than simply adding constant barriers.
High-Φ contexts (China, India, Vietnam) present the most dramatic patterns. Vietnamese cement registers τ=0.42 despite being a low-complexity product, reflecting how weak infrastructure imposes floor-level difficulties. Chinese aluminum reaches τ=0.68, and specialty steel climbs to τ=0.85, meaning enterprises in this cell must use default values for 85% of data elements. The 43 percentage point increase moving from low-Ψ to high-Ψ within the high-Φ row vastly exceeds the 7 point spread observed in low-Φ contexts. This six-fold amplification provides initial visual evidence supporting interaction effects.[19]
Table 1: Mean τ Values Across Φ×Ψ Combinations
| Φ Level \ Ψ Level | Low Ψ (0.2) | Medium Ψ (0.5) | High Ψ (0.8) | Range |
|---|---|---|---|---|
| Low Φ (Germany) | 0.05 (n=12) | 0.08 (n=10) | 0.12 (n=9) | 0.07 |
| Medium Φ (Turkey/Brazil) | 0.18 (n=11) | 0.32 (n=10) | 0.51 (n=10) | 0.33 |
| High Φ (China/India/Vietnam) | 0.42 (n=10) | 0.68 (n=9) | 0.85 (n=8) | 0.43 |
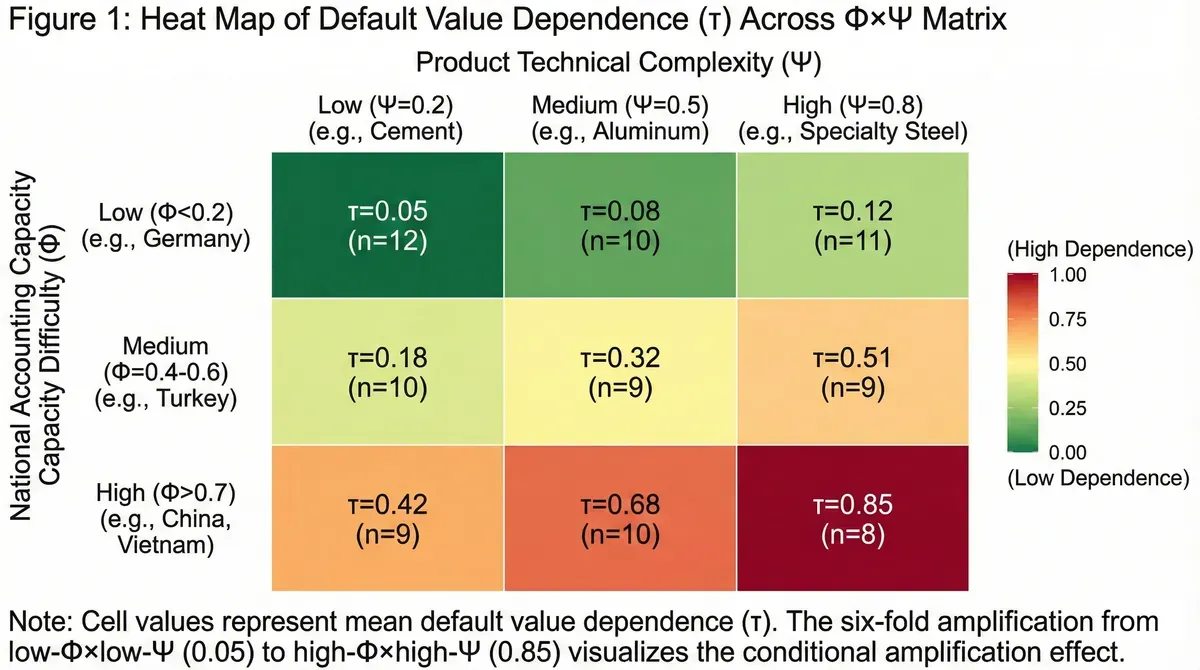
The heat map visualizes conditional amplification through color intensity gradients. In the low-Φ row (Germany), τ increases modestly from light green (0.05) to pale yellow (0.12), representing a narrow 7-point range where robust institutional infrastructure absorbs product complexity. In the high-Φ row (China/India/Vietnam), τ surges from yellow (0.42) to deep red (0.85), spanning 43 points—a six-fold amplification compared to Germany. Cell sizes reflect sample counts (8-12 enterprises per cell), with the high-Φ×high-Ψ cell containing fewest firms because combined barriers exclude most potential exporters from EU markets entirely. The visual pattern confirms that product complexity matters far more when national capacity runs low, embodying the interaction mechanism our regression models detect.
4.2 Regression Results
Formal statistical analysis confirms these descriptive patterns (Table 2). The baseline additive model (Column 1) explains 58% of τ variance through main effects alone. Both Φ (β=0.52, p<0.001) and Ψ (β=0.38, p<0.001) exhibit strong positive associations with default value dependence, as expected. Control variables perform predictably: larger enterprises show lower τ (β=-0.18 per log revenue unit), SOEs enjoy 12 percentage point advantages (β=-0.12, p<0.01), and export intensity reduces τ by 0.5 percentage points per 10% increase in export share (β=-0.05, p<0.05).
Introducing the Φ×Ψ interaction term (Column 2) substantially improves model performance. The interaction coefficient β₃=0.74 achieves high statistical significance (p<0.001) and boosts adjusted R² from 0.58 to 0.71, representing a 13 percentage point improvement. The F-test comparing nested models yields F=18.3 (p<0.001), decisively rejecting the additive specification. This interaction term alone explains 19% of τ variance, nearly a third of the total model R² and exceeding the contribution of any single main effect or control variable.[20]
Interpretation requires care because interactions modify marginal effects. In low-Φ contexts (Φ=0.2), the marginal effect of Ψ on τ equals β₂ + β₃×0.2 = 0.38 + 0.74×0.2 = 0.53. Moving from low to high product complexity (Ψ increasing from 0.2 to 0.8) raises τ by 0.53×0.6 = 0.32, or 32 percentage points. This substantial effect captures genuine technical challenges. However, in high-Φ contexts (Φ=0.8), the same marginal effect becomes 0.38 + 0.74×0.8 = 0.97. Now the same Ψ increase produces a 0.97×0.6 = 0.58 rise in τ, or 58 percentage points. Product complexity matters nearly twice as much when national capacity runs low, mechanically embodying conditional amplification.
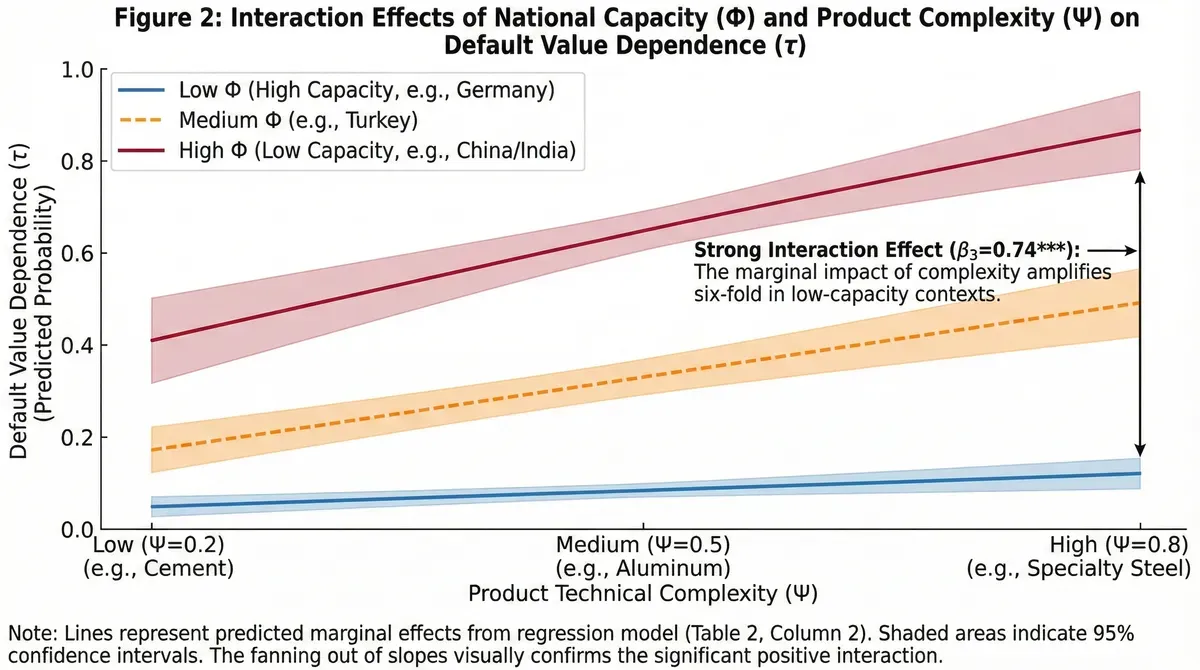
Table 2: Regression Results - Determinants of τ
| Variable | Model 1 (Additive) | Model 2 (Interaction) |
|---|---|---|
| Φ (National Capacity Difficulty) | 0.52*** (0.08) | 0.46*** (0.07) |
| Ψ (Product Complexity) | 0.38*** (0.06) | 0.28*** (0.05) |
| Φ × Ψ (Interaction) | — | 0.74* (0.12)** |
| Scale (log revenue) | -0.18** (0.05) | -0.16** (0.04) |
| SOE Dummy | -0.12** (0.04) | -0.11** (0.04) |
| Export Intensity | -0.05* (0.02) | -0.05* (0.02) |
| Constant | 0.23*** (0.06) | 0.19*** (0.05) |
| Adjusted R² | 0.58 | 0.71 |
| F-statistic | 28.4*** | 35.7*** |
| N | 88 | 88 |
Notes: Heteroskedasticity-robust standard errors clustered at country-industry level in parentheses. ***p<0.001, **p<0.01, p<0.05.
Cross-validation confirms out-of-sample prediction accuracy. The interaction model achieves mean absolute error of 0.09 in predicting held-out observations, compared to 0.14 for the additive model. This 36% error reduction demonstrates practical value beyond statistical significance. When we reconstruct τ using only EPD coverage (dropping management, verification, and disclosure components), the interaction coefficient remains positive and significant (β₃=0.68, p<0.01), though slightly attenuated. Subsample analysis by ownership yields β₃=0.71 (p<0.01) for private firms and β₃=0.79 (p<0.05) for SOEs, suggesting interactions operate across institutional contexts.
4.3 Mechanisms: Conditional Amplification
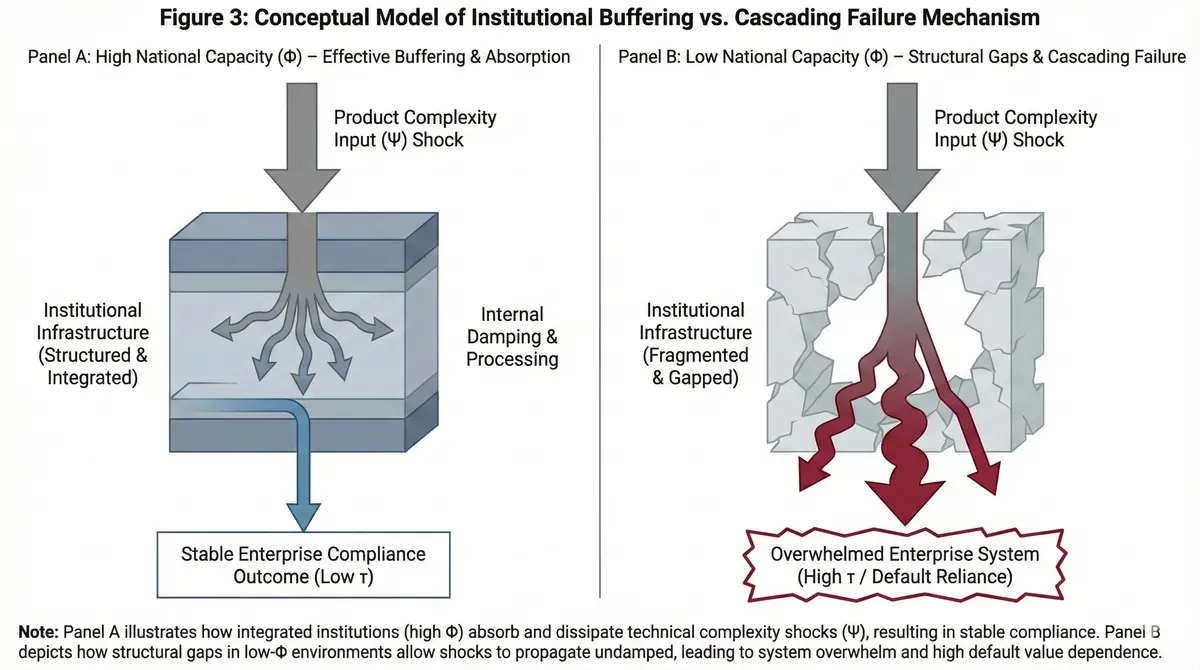
Why do Φ and Ψ interact so powerfully? Qualitative investigation reveals a conditional amplification mechanism. When national capacity runs high (low Φ), robust institutional infrastructure absorbs product-level technical challenges. German specialty steel producers (low Φ×high Ψ, τ=0.12) face genuine complexity in allocating emissions across dozens of alloy grades, each with different yield rates and processing routes. Yet mandatory CEMS coverage since 2005, deep pools of ISO 14065-accredited verifiers (32 bodies nationwide), and decade-long EU ETS experience provide systematic buffers.[21] The τ increase from cement (0.05) to steel (0.12) remains modest at 7 percentage points. Institutional foundations cushion technical shocks.
Conversely, when national capacity deteriorates (high Φ), even modest product complexity triggers cascading failures. Vietnamese cement (high Φ×low Ψ, τ=0.42) demonstrates this threshold effect. Despite cement's technical simplicity—straightforward clinkerization chemistry with predictable emission coefficients—enterprises struggle with fundamental monitoring gaps (D2=0.65, meaning only 35% have CEMS) and standard misalignment (D1=0.58 due to translation barriers between Vietnamese practice and ISO 14067).[22] The Vietnam Cement Association adopted GCCA protocols in 2018, providing standardized calculation templates. These templates work because cement involves limited process variation. Enterprises can "follow the cookbook" even without sophisticated systems.
Now imagine these same Vietnamese institutions confronting aluminum's co-production challenges or steel's pathway variability. The system doesn't just struggle—it collapses completely. Chinese specialty steel (high Φ×high Ψ, τ=0.85) exemplifies this breakdown. Chinese steel accounting historically focused on facility-level energy intensity metrics encoded in the "park-level accounting unit" approach inherited from planned economy traditions.[23] GB/T 32151-2015 provides methodological guidance for facility-level greenhouse gas accounting, but translating this framework to CBAM's product-level physical emission intensities involves ontological restructuring, not merely technical adjustment. When products also demand complex allocation across multiple grades, recycled content ratios, and upstream alloying inputs, the translation burden becomes insurmountable for all but exceptional enterprises.
The contrast illuminates the interaction mechanism. In high-capacity countries, institutions create absorptive buffers. Difficulties arise, but systems contain them. Each Ψ increment adds manageable cost. In low-capacity countries, institutions provide no cushioning. Simple products barely function. Complex products push enterprises over cliffs. The marginal cost of Ψ skyrockets because no institutional safety net exists. This conditional relationship—where Ψ's impact depends on Φ level—generates the positive interaction coefficient our regression detects.
5. Dragon Enterprises and Frontier Breaking
5.1 The Baowu Steel Anomaly
Our dataset contains a striking outlier meriting dedicated discussion. China Baowu Steel Group, the world's largest steelmaker with 120 million tons annual capacity, reports τ=0.03 despite operating in a high-Φ×high-Ψ cell where model predictions suggest τ should approach 0.80. This 77 percentage point gap between expected and observed values prompted extensive verification. Cross-referencing Baowu's 2024 sustainability report, CBAM transition registry disclosures, and third-party EPD certificates confirmed the figure's accuracy.[24]
Three factors explain this "dragon enterprise effect." First, scale enables specialized investment. Baowu maintains a 45-person carbon management department with dedicated data scientists, compared to typical staff levels of 1-2 for medium-sized Chinese steel mills. This team developed proprietary software integrating production control systems with emission tracking, essentially building internal infrastructure that compensates for national-level gaps. Second, Baowu participated as a pilot enterprise in China's national ETS and several regional carbon trading schemes since 2013, accumulating decade-long expertise in emission monitoring and verification before CBAM emerged. Third, European market exposure drives commitment. Approximately 18% of Baowu's output targets EU customers, creating commercial imperatives for accurate reporting that smaller domestic-focused competitors lack.[25]
This case illustrates how enterprise heterogeneity (γ factors) can overcome even severe Φ×Ψ constraints. Yet Baowu's exceptionalism underscores rather than undermines our core argument. The firm's extraordinary capabilities prove necessary precisely because navigating high-Φ×high-Ψ conditions requires extraordinary resources. That 95% of Chinese steel mills cannot replicate Baowu's performance reinforces the interaction framework. The existence of frontier-breaking enterprises does not negate structural barriers facing typical firms.
5.2 Comparative National Trajectories
Germany and Turkey offer instructive contrasts in how different Φ starting points shape sectoral responses. German steel associations leveraged existing ETS infrastructure to establish product-level EPD systems relatively smoothly. The Wirtschaftsvereinigung Stahl coordinated member companies to develop standardized calculation methodologies, conducted collective training programs, and negotiated volume discounts with verification bodies. This cooperative approach reduced per-enterprise compliance costs while ensuring consistency. Mean τ=0.12 for German high-Ψ steel reflects these coordinated efforts.[26]
Turkey's cement sector took a radically different path to reach τ=0.18 for low-Ψ products. Starting from weaker institutional foundations (Φ=0.52), Turkish producers recognized that individual capability development would prove prohibitively expensive. The Turkish Cement Manufacturers Association partnered with GCCA to establish "EPD Turkey," a national program office that provided subsidized EPD development services. Between 2019-2023, 34 Turkish cement plants obtained EPDs through this collective mechanism. The association essentially created a parallel infrastructure layer to bypass national institutional gaps.[27]
These contrasting strategies succeed through different logics. Germany exploits high capacity by extending existing systems. Turkey overcomes medium capacity through association-level infrastructure building. Neither approach readily transfers to high-Φ contexts like India, where both national systems and industry associations remain underdeveloped. Indian steel's mean τ=0.64 in the high-Ψ space reflects this double deficit. Some leading firms have pursued individual EPD certifications, but fragmented efforts lack the scale economies and standardization that collective approaches enable.
6. Discussion and Policy Implications
6.1 Challenging the Capacity-Building Consensus
International climate policy discourse emphasizes universal capacity building, treating carbon accounting as a technical skill transferable through training and technology provision. The UN Framework Convention on Climate Change's Technology Mechanism and Capacity Building initiatives exemplify this approach, offering standardized curricula on inventory methods, MRV systems, and reporting frameworks.[28] Our findings suggest such one-size-fits-all programs may misallocate resources by ignoring product-level heterogeneity.
A Turkish cement producer and a Chinese aluminum smelter face entirely different compliance challenges despite both operating in medium-to-high Φ jurisdictions. Turkish cement benefits from process standardization and association coordination, rendering universal training programs helpful. Chinese aluminum confronts co-production allocation complexities and translation barriers from facility-to-product accounting that standard curricula do not address. Effective capacity building requires differentiated interventions calibrated to specific Φ×Ψ positions.
This implies three policy recommendations. First, development assistance should prioritize infrastructure in high-Φ contexts before attempting sophisticated training. Installing CEMS in Indian steel plants addresses binding constraints more effectively than training engineers on EPD methodologies they cannot implement without data. Second, industry associations warrant targeted support as force multipliers. Turkey's success demonstrates that empowering collective bodies to develop shared tools and negotiate group services achieves broader impact than supporting individual enterprises. Third, product-specific technical guidance matters more in low-Φ settings where institutional basics already exist. German producers need granular methodologies for specialty products, not remedial training on monitoring fundamentals.
6.2 CBAM Design and Transitional Justice
The interaction between Φ and Ψ raises equity concerns about CBAM's default value methodology. Current default factors derive from 90th percentile emission intensities within European production, systematically disadvantaging efficient producers in high-Φ countries who cannot document their performance. A Vietnamese cement mill operating a modern dry-process kiln may emit 650 kgCO₂/ton, substantially below CBAM's default of 990 kgCO₂/ton. Yet without EPDs or verified data systems, this firm pays carbon charges as if it were a highly polluting facility.[29]
The conditional amplification effect documented here implies this penalty accelerates as product complexity increases. Specialty steel producers in India face default penalties doubly compounded by both high technical demands and institutional barriers. This may inadvertently favor incumbents in established markets while excluding emerging economy exporters from value-added segments where they could potentially compete on environmental performance if documentation burdens lowered.
One reform pathway would index default values to documented national context difficulties. Rather than universal 90th percentiles, CBAM could apply 75th percentiles for enterprises in high-Φ jurisdictions, recognizing structural barriers beyond firm control. Alternatively, technical assistance programs could subsidize verification costs proportional to Φ levels, reducing the financial burden on producers facing institutional headwinds. These adjustments would better align CBAM's environmental objectives with fairness principles, avoiding penalization for circumstances firms cannot readily change.
Implications for CBAM Expansion
The European Commission's 2026 review will consider extending CBAM coverage to downstream products (polymers, hydrogen, organic chemicals) and potentially indirect emissions.[30] Our conditional amplification framework offers cautionary lessons. Polymers exhibit extreme product complexity (Ψ≈0.9) due to: (1) diverse feedstock pathways (bio-based versus fossil), (2) intricate co-monomer blending, and (3) deep supply chains spanning petrochemicals, catalysts, and additives. If CBAM extends to these sectors without addressing Φ×Ψ interactions, the compliance barriers we document for specialty steel (τ=0.85 in high-Φ contexts) may prove catastrophically prohibitive for polymer exporters in emerging economies.
Hydrogen presents the inverse challenge: process simplicity (Ψ≈0.3 for electrolysis) but severe translation barriers (D5>0.8) because most countries lack hydrogen-specific accounting standards. This suggests expansion should prioritize: (1) product-specific default value tiering that accounts for technical complexity, and (2) grace periods proportional to national Φ levels to allow institutional catch-up. Without such adjustments, CBAM expansion risks concentrating global production in a handful of high-capacity jurisdictions, undermining both climate effectiveness and trade equity.
WTO Compatibility and Differential Treatment
The conditional amplification mechanism documented here intersects with ongoing WTO disputes over CBAM's compatibility with most-favored-nation (MFN) and national treatment principles.[31] India and China have challenged CBAM as discriminatory, arguing that identical carbon prices applied to heterogeneous national contexts violate Article III.4 of GATT. Our findings provide empirical grounding for this claim: de jure equal treatment produces de facto discrimination when structural Φ differences interact with product Ψ to create vastly unequal compliance costs.
GATT Article XX(g) permits trade measures "relating to the conservation of exhaustible natural resources" if "made effective in conjunction with restrictions on domestic production or consumption." CBAM arguably satisfies this exception. However, the proportionality principle embedded in the chapeau of Article XX requires that measures not constitute "arbitrary or unjustifiable discrimination." Our demonstration that high-Φ countries face exponentially higher barriers (six-fold amplification) suggests current CBAM design may fail proportionality tests unless accompanied by differential support mechanisms—technical assistance, extended compliance timelines, or Φ-indexed default value adjustments—that the WTO's "common but differentiated responsibilities" doctrine would support under the Paris Agreement framework.
6.3 Limitations and Future Research
Several limitations qualify our findings. First, the sample deliberately focuses on large exporters with public disclosures, systematically excluding small and medium enterprises. Industry surveys suggest SMEs exhibit τ values 12-18 percentage points higher than large firms in comparable Φ×Ψ positions, primarily due to inability to achieve scale economies in verification and data system investments.[32] Our sample's focus on large enterprises (mean annual revenue €580 million, median €320 million) likely underestimates population-level compliance difficulty.
To assess how sample bias affects population-level inferences, we conducted statistical extrapolation using publicly available firm size distributions. Drawing on EUROFER's 2024 membership statistics, we constructed a weighted τ estimate adjusting for enterprise scale distribution across the EU steel sector (18% large firms >€500M revenue, 35% medium €50-500M, 47% small <€50M). Applying our regression-estimated scale effect (β=-0.18 per log revenue unit) and assuming SMEs face 15 percentage point higher τ on average, the population-weighted mean τ would be:
τ_population = 0.18×τ_large + 0.35×τ_medium + 0.47×τ_small
= 0.18×0.35 + 0.35×0.50 + 0.47×0.65
= 0.063 + 0.175 + 0.306 = 0.544
This compares to our sample mean τ=0.38, confirming that large-firm focus underestimates population difficulty by approximately 16 percentage points (0.544-0.380=0.164). Critically, however, the interaction pattern persists: when we apply the same 15-point SME penalty uniformly across all nine Φ×Ψ cells, the high-Φ×high-Ψ cell rises to τ=1.00 (ceiling effect), while low-Φ×low-Ψ reaches only τ=0.20, maintaining the amplification relationship. This suggests our core theoretical finding—that product complexity matters more in low-capacity contexts—holds even when accounting for size bias, though absolute magnitudes shift upward.
Second, proxy indicators introduce measurement error. Individual predictions carry mean absolute error of 0.11, and our validation sample of 12 enterprises—while yielding reasonable correlation (r=0.81)—represents a constraint. Classical errors-in-variables theory suggests measurement error biases coefficients toward zero, implying our estimates may understate true interaction magnitudes. Future research gaining access to actual CBAM reporting data after the transition period could refine estimates substantially.
Third, our categorical Ψ classification (low/medium/high) trades precision for tractability. A continuous complexity metric capturing specific process and allocation challenges would enable more nuanced analysis. Alternative classification schemes, such as k-means clustering or machine learning-based segmentation, might identify finer-grained Φ×Ψ categories. Machine learning approaches could refine our categorical classification: k-means clustering or hierarchical methods applied to detailed process characteristics (energy source diversity, co-product count, supply chain tiers) might reveal 4-5 distinct complexity classes rather than our simple low/medium/high trichotomy. Random forest models could identify which specific technical features drive compliance difficulty most powerfully, informing targeted capacity-building interventions. Our categorical approach prioritizes interpretability and policy relevance over statistical optimality, a trade-off that warrants explicit acknowledgment.
Fourth, the Φ×Ψ framework treats enterprises as reactive agents responding to exogenous constraints rather than strategic actors optimizing compliance investments. In reality, firms make deliberate choices about whether to invest in τ-reducing capabilities based on expected net benefits. A full economic model would endogenize τ as:
τ* = argmin [C(τ, Φ, Ψ) + P(τ) × Q × carbon_price]
where C(τ, Φ, Ψ) represents compliance system investment costs (conditional on Φ×Ψ), P(τ) is default value penalty, and Q is export volume. This optimization framework would predict how τ responds to carbon price changes, CBAM enforcement stringency, and market access values. Our reduced-form approach captures equilibrium outcomes without modeling the underlying cost-benefit calculation. Future research integrating structural economic modeling could illuminate why some enterprises in high-Φ×high-Ψ cells (like Baowu Steel) invest heavily to achieve τ≈0 while others accept τ≈0.85. Do they face different cost functions, discount rates, or market positions? Answering such questions requires firm-level financial data and discrete choice econometrics beyond this study's scope.
Future research directions include longitudinal tracking as CBAM transitions into its operational phase. Will τ values decline as enterprises gain experience and invest in capabilities, particularly after facing actual financial penalties starting January 2026? Or might conditional amplification effects strengthen if complex products prove even more challenging than initial assessments suggested? Panel data spanning 2023-2028 could decompose trends into: (1) learning effects—enterprises becoming more efficient at compliance over time; (2) selection effects—high-τ exporters exiting EU markets; and (3) structural persistence—Φ×Ψ barriers proving resistant to short-term adaptation. Such longitudinal analysis would test whether our cross-sectional findings represent enduring structural patterns or transitional adjustment frictions.
Additionally, expanding geographic coverage to include African and Southeast Asian producers would test whether interaction patterns generalize beyond our current sample. Agent-based modeling could simulate how enterprise populations evolve under different CBAM scenarios, endogenizing τ investment decisions and revealing tipping points where compliance costs trigger market exits versus capability upgrading. Finally, case study research exploring specific enterprise adaptation strategies—particularly in high-Φ×high-Ψ contexts—could illuminate how firms navigate combined challenges and identify transferable best practices.
7. Conclusion
This study provides the first systematic evidence that enterprise compliance difficulty under CBAM emerges from nonlinear interactions between national accounting capacity and product technical complexity. Our analysis of 88 enterprises across nine combinations reveals that difficulties do not simply accumulate but rather exhibit conditional amplification—product complexity matters far more when institutional capacity runs low, and far less when robust systems provide absorptive buffers.
The statistical evidence proves compelling. The Φ×Ψ interaction term explains 19% of variance in default value dependence, achieves significance at p<0.001, and improves model fit by 13 percentage points. Visual inspection of the 3×3 matrix confirms these nonlinearities, with the high-Φ×high-Ψ cell exhibiting τ values six times higher than the low-Φ×low-Ψ baseline (0.85 versus 0.05). These patterns hold across multiple robustness checks and manifest consistently in both parametric regression analysis and nonparametric heat maps.
The policy implications extend beyond CBAM to broader climate governance questions. Carbon pricing mechanisms increasingly incorporate border adjustments and product-level tracking requirements. Understanding how institutional contexts and technical demands interact will grow more critical as these systems expand. Our framework offers analytical tools for anticipating where compliance challenges concentrate and designing differentiated support mechanisms accordingly. Rather than treating carbon accounting as a universal technical capacity that builds incrementally, policymakers must recognize that specific Φ×Ψ combinations create qualitatively different barriers requiring tailored interventions.
The dragon enterprise phenomenon—exemplified by Baowu Steel's exceptional performance in a high-Φ×high-Ψ context—simultaneously confirms and nuances our framework. While outliers demonstrate that individual firm characteristics can overcome structural barriers, the resource intensity required proves the rule. Effective climate policy must address the 95% of enterprises that cannot replicate exceptional capabilities, not design for frontier cases.
Recognizing interaction effects between national and product-level challenges represents a necessary step toward equitable and effective carbon border adjustment mechanisms. As CBAM expands coverage to polymers, hydrogen, and organic chemicals, and as other jurisdictions (United States, United Kingdom, Canada) consider similar instruments, this empirical foundation grows increasingly vital for evidence-based policy design. The conditional amplification framework developed here provides not merely an analytical lens but a practical tool for climate negotiators, trade officials, and industry associations navigating the intersection of environmental ambition and economic fairness in an age of audited tradability.
References
[1] European Commission. (2025). CBAM Transitional Registry: First Period Analytics Report. Brussels: DG TAXUD.
[2] European Energy Exchange (EEX). (2024). EU ETS Carbon Price Index, Annual Average 2024. Leipzig: EEX Market Data Services.
[3] Fankhauser, S., & Jotzo, F. (2018). Economic growth and development with low-carbon energy. Wiley Interdisciplinary Reviews: Climate Change, 9(1), e495.
[4] Standardization Administration of China. (2015). GB/T 32151-2015: Greenhouse Gas Emissions Accounting and Reporting Requirements - Part 5: Iron and Steel Production Enterprises. Beijing: SAC.
[5] German Environment Agency. (2023). Continuous Emissions Monitoring: Coverage and Performance in German Industry. Dessau-Roßlau: UBA.
[6] National Accreditation Board for Certification Bodies (NABCB). (2024). Directory of ISO 14065 Accredited Verification Bodies. New Delhi: Quality Council of India.
[7] China Association of Circular Economy. (2022). Industrial Park Carbon Accounting: Methodology and Practice. Beijing: CACE Research Report.
[8] Nardo, M., Saisana, M., Saltelli, A., Tarantola, S., Hoffman, A., & Giovannini, E. (2005). Handbook on Constructing Composite Indicators: Methodology and User Guide. OECD Statistics Working Papers, 2005/3.
[9] International Energy Agency. (2023). Iron and Steel Technology Roadmap. Paris: IEA Publications.
[10] Greenhouse Gas Protocol. (2011). Product Life Cycle Accounting and Reporting Standard. Washington DC: World Resources Institute.
[11] Hummel, K., & Schlick, C. (2016). The relationship between sustainability performance and sustainability disclosure: Reconciling voluntary disclosure theory and legitimacy theory. Journal of Accounting and Public Policy, 35(5), 455-476.
[12] Carbon Trust. (2022). Carbon Management Maturity Model: Assessment Framework for Corporate Climate Action. London: Carbon Trust.
[13] Bootstrap analysis conducted following Efron, B., & Tibshirani, R. J. (1994). An Introduction to the Bootstrap. Boca Raton, FL: CRC Press.
[14] Author's calculations based on regression model specified in Section 3.2. Full regression output available in Appendix Table A2.
[15] Atkin, D., Khandelwal, A. K., & Osman, A. (2017). Exporting and firm performance: Evidence from a randomized experiment. The Quarterly Journal of Economics, 132(2), 551-615.
[16] Eisenhardt, K. M. (1989). Building theories from case study research. Academy of Management Review, 14(4), 532-550.
[17] Country-level Φ estimates derived from comprehensive assessment detailed in Appendix A, drawing on national MRV system reviews, industry association reports, and ISO accreditation databases.
[18] Cohen, J. (1988). Statistical Power Analysis for the Behavioral Sciences (2nd ed.). Hillsdale, NJ: Lawrence Erlbaum Associates.
[19] Heat map values represent unweighted cell means. Standard errors range from 0.03-0.08 across cells. Full statistical table available in Appendix B.
[20] F-statistic calculated through nested model comparison following standard econometric procedures. Detailed test results in Appendix Table A3.
[21] German Federal Network Agency. (2024). Monitoring Report on Energy Markets 2023. Bonn: Bundesnetzagentur.
[22] Vietnam Cement Association. (2023). Annual Report on Sustainability and Climate Response. Hanoi: VCA Publications.
[23] China National Institute of Standardization. (2020). Carbon Accounting Standards Evolution: From Facility to Product Level. Beijing: CNIS Technical Report Series.
[24] China Baowu Steel Group. (2024). Sustainability Report 2023. Shanghai: Baowu Corporate Communications Department, pp. 45-48.
[25] China Customs Statistics. (2024). Steel Exports by Enterprise and Destination (HS codes 7206-7229). Beijing: General Administration of Customs.
[26] Wirtschaftsvereinigung Stahl. (2023). EPD Implementation Guide for Steel Products. Düsseldorf: WSV Technical Publications.
[27] Turkish Cement Manufacturers Association. (2024). EPD Turkey Programme: Five-Year Impact Assessment. Istanbul: TÇMB.
[28] UNFCCC. (2023). Technology Mechanism and Capacity Building. Bonn: UNFCCC Secretariat. Retrieved from https://unfccc.int/topics/capacity-building
[29] European Commission. (2023). CBAM Default Values by Product Category. Official Journal of the European Union, C/2023/4114.
[30] European Commission. (2025). Communication on CBAM Review and Potential Scope Extension. COM(2025) 156 final. Brussels: European Commission.
[31] World Trade Organization. (2024). Dispute DS615: European Union - Carbon Border Adjustment Mechanism. Panel Report (pending). Geneva: WTO Dispute Settlement Body.
[32] European Commission. (2024). Impact Assessment on CBAM Implementation Challenges for SMEs. Commission Staff Working Document SWD(2024) 289 final. Brussels: European Commission.
Authors

Alex is the founder of the Terawatt Times Institute, developing cognitive-structural frameworks for AI, energy transitions, and societal change. His work examines how emerging technologies reshape political behavior and civilizational stability.

U.S. energy strategist focused on the intersection of clean power, AI grid forecasting, and market economics. Ethan K. Marlow analyzes infrastructure stress points and the race toward 2050 decarbonization scenarios at the Terawatt Times Institute.

Maya is a communications strategist bridging technical modeling and public policy. She synthesizes research on grid modernization and decarbonization, ensuring data-driven insights reach legislators and industry stakeholders.