From Sensors to Standards: A Privacy-Preserving Carbon Data Infrastructure for Global CBAM Compliance
Abstract
The European Union's Carbon Border Adjustment Mechanism (CBAM) has transformed carbon emissions data from voluntary reporting into a mandatory trade prerequisite, creating acute compliance barriers for small and medium enterprises in global supply chains. This study presents an integrated three-layer infrastructure addressing the structural deficiencies in current carbon monitoring systems. We demonstrate that combining low-cost industrial IoT sensors (Layer 1), zero-knowledge cryptographic verification protocols (Layer 2), and dynamic grid carbon intensity tracking (Layer 3) enables CBAM compliance at substantially lower total cost of ownership—up to 88% reduction under representative five-year deployment scenarios with quarterly calibration schedules—compared to traditional Continuous Emissions Monitoring Systems. The framework resolves three critical tensions: cost accessibility versus data quality, verification transparency versus commercial confidentiality, and standardization uniformity versus contextual appropriateness. Through modeling-based analysis validated against industrial parameters from Vietnamese cement and Chinese aluminum sectors, we establish that properly architected IoT systems achieve Level 4 data quality (5-8% uncertainty), aligning with uncertainty thresholds applicable to CBAM Category A facilities. Zero-knowledge succinct non-interactive arguments of knowledge (ZK-SNARKs) enable computational verification without exposing proprietary process parameters, protecting competitive intelligence while satisfying regulatory requirements. For electricity-intensive sectors, hourly-resolution carbon intensity data combined with production optimization reduces default value dependency ratios from 0.68 to 0.45, translating to €5+ million annual savings for representative aluminum exporters under current CBAM pricing assumptions. The proposed Grid Carbon Intensity Ontology (GCIO) standard demonstrates 96% field coverage accuracy across five national data formats in pilot testing. This infrastructure transforms carbon data from compliance burden into strategic asset, establishing technical foundations for inclusive industrial decarbonization. Pilot implementations planned for 2026-2027 will provide empirical validation of these modeling-based projections.
Keywords: Carbon Border Adjustment Mechanism, Industrial IoT, Zero-Knowledge Proofs, CBAM Compliance, Carbon Accounting, Privacy-Preserving Verification, Grid Carbon Intensity
1. Introduction: The Carbon Data Infrastructure Gap
1.1 CBAM as Trade Infrastructure Revolution
The implementation of the European Union's Carbon Border Adjustment Mechanism represents a fundamental transformation in how carbon emissions intersect with international commerce. Beginning October 2023, CBAM requires importers of steel, cement, aluminum, fertilizers, electricity, and hydrogen to report embedded emissions with increasing precision, transitioning from estimated calculations to verified measurements [1]. The mechanism employs punitive default values calculated from the worst-performing installations in the EU, creating substantial financial penalties for entities unable to provide actual emissions data. For a mid-sized Chinese aluminum smelter exporting 20,000 tons to EU markets annually, the differential between CBAM default emission intensity (16.0 tons CO₂ per ton) and verified actual performance (12.5 tons per ton) translates to approximately €5.6 million in excess CBAM certificate costs at current carbon prices when unable to provide verified emissions data [2]. This penalty derives not from poor environmental performance but from inadequate data infrastructure—a structural barrier affecting an estimated 65% of CBAM-affected entities classified as small and medium enterprises.
This regulatory shift exposes a critical infrastructure deficit spanning developing and developed economies alike. Current carbon accounting systems exhibit what we term the "missing middle layer" between precision and accessibility. At one extreme, traditional Continuous Emissions Monitoring Systems (CEMS) deliver regulatory-grade accuracy through sophisticated instrumentation, but require capital investments of €80,000-150,000 per emission point plus €18,000-20,000 annual operational expenditure [3]. These costs create insurmountable barriers for the majority of CBAM-affected enterprises. At the opposite extreme, manual calculation methods based on fuel invoices and annual emission factors lack temporal resolution and cryptographic integrity, making them increasingly unacceptable to regulatory authorities despite minimal implementation costs [4].
The binary choice between unaffordable precision and inadequate estimation forces enterprises into untenable positions. Accept prohibitive monitoring infrastructure costs or face default value penalties that render export operations economically unviable. This dilemma intensifies in developing economies where CBAM-covered sectors represent substantial portions of industrial GDP. India's steel exports, China's aluminum production, and Turkey's cement manufacturers exemplify this vulnerability, with combined EU export exposure exceeding 15 dollars billion annually [5].
1.2 Three Structural Challenges Beyond Cost
The carbon data infrastructure gap extends beyond capital expenditure barriers to encompass interconnected structural tensions that existing approaches fail to resolve adequately. The privacy-verification paradox emerges when detailed emissions reporting requirements conflict with commercial confidentiality protection. CBAM mandates disclosure of activity data, emission factors, and process parameters sufficient to verify calculation correctness. For steel producers, this includes blast furnace gas utilization rates, waste heat recovery efficiency, and alloy-specific production parameters that represent decades of process optimization investment [6]. Revealing these metrics enables competitors to reverse-engineer operational strategies, creating an impossible choice between regulatory compliance and intellectual property protection.
The data sovereignty-transparency conflict arises from collision between multinational verification demands and national data protection regimes. China's Data Security Law restricts cross-border transfer of industrial process data, creating legal jeopardy for enterprises that fully comply with CBAM disclosure mandates [7]. Similar tensions emerge in India's data protection frameworks and Turkey's industrial security regulations. This structural conflict between carbon transparency requirements and data sovereignty principles threatens to fragment global carbon accounting into incompatible national systems.
The standardization-context tension manifests in regulatory frameworks that mandate uniform methodologies despite vast differences in industrial contexts. CBAM's prescriptive monitoring requirements implicitly assume access to stable electricity grids, skilled technical personnel, and established calibration infrastructure. These assumptions hold in Western Europe but fail across much of the global industrial base. A Vietnamese cement plant operating in regions with intermittent power supply faces fundamentally different implementation constraints than a German facility with comprehensive digital infrastructure [8].
In practice, enterprises often respond to these tensions through partial disclosure strategies and methodological arbitrage, satisfying formal reporting requirements while undermining verification credibility through selective data presentation. This behavioral adaptation highlights why technical solutions must address not merely measurement precision but also the institutional incentives shaping reporting practices.
1.3 Integrated Architecture Response
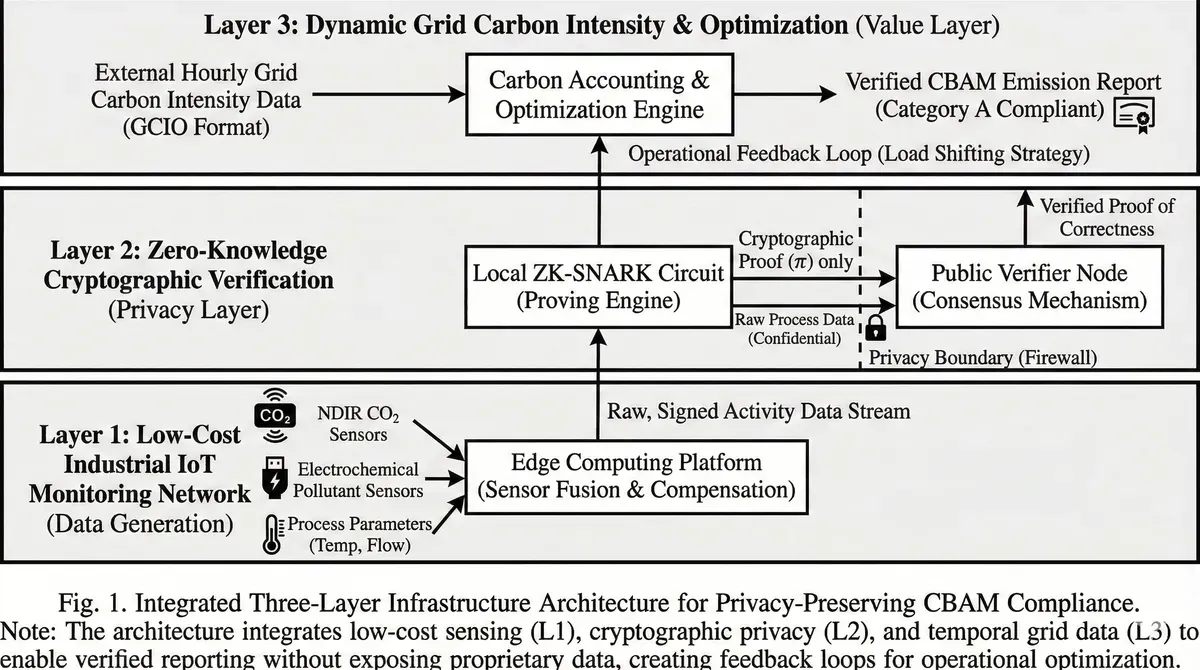
This research presents a three-layer technical framework addressing these interconnected challenges through synergistic integration rather than isolated solutions. Layer 1 establishes low-cost sensor networks employing industrial IoT components and edge computing platforms, achieving regulatory-acceptable data quality through computational compensation rather than physical precision. Layer 2 implements zero-knowledge cryptographic protocols enabling mathematical verification of calculation correctness without exposing underlying process data, resolving the privacy-verification paradox. Layer 3 develops dynamic grid carbon intensity mapping with temporal resolution appropriate to sector-specific operational patterns, enabling load optimization strategies that multiply the economic returns from monitoring infrastructure.
The architecture's power emerges from recognition of feedback loops across layers. Enhanced monitoring precision enables operational optimization that generates higher-quality data, justifying investment in privacy-preserving verification infrastructure. Hourly-resolution grid intensity data empowers production scheduling adjustments that demonstrate measurable emission reductions, creating compelling business cases for monitoring system deployment. Privacy protection through zero-knowledge proofs removes data sovereignty barriers, enabling international verification without cross-border data transfer.
The framework transforms carbon data infrastructure from unavoidable compliance cost into strategic capability enabling multiple value streams. Beyond regulatory cost mitigation, the data infrastructure supports participation in voluntary carbon markets, qualification for green procurement preferences, and access to climate-aligned financial instruments. For electricity-intensive industries, the same monitoring infrastructure enables grid flexibility market participation and demand response revenue generation. Privacy-preserving verification capabilities create pathways to carbon credit monetization previously unavailable to enterprises unable to protect process confidentiality [9].
Our contribution extends beyond technical specifications to advance an alternative governance philosophy for global carbon systems. Rather than pursuing uniformity through prescriptive standardization, we demonstrate that graduated precision frameworks and technology-neutral performance standards can expand participation while maintaining accountability. The modular architecture accommodates heterogeneous deployment patterns reflecting diverse capital constraints and operational contexts, establishing pathways for inclusive industrial decarbonization.
2. Layer 1: Low-Cost Monitoring Through Architectural Innovation
2.1 The Engineering Philosophy of Traditional CEMS
Understanding why conventional emissions monitoring systems command prohibitive costs requires examining their underlying design philosophy. Traditional CEMS embody what might be termed a "brute force environmental control" paradigm, creating laboratory conditions in hostile industrial settings through aggressive physical isolation and thermal management. The approach succeeds brilliantly for large facilities where monitoring costs represent less than 0.1% of capital expenditure, but creates insurmountable barriers for smaller operations where the same installation might consume 5-10% of annual operating profit [10].
A typical CEMS installation comprises six major subsystems, each contributing substantially to both capital and operational expenditure. The analytical core employs high-precision spectroscopic instruments utilizing Fourier Transform Infrared (FTIR) or advanced Non-Dispersive Infrared (NDIR) technologies, accounting for 30,000-70,000 dollars of initial investment. These instruments demand gold-plated gas cells and temperature-stabilized detectors to achieve the 1-2% measurement uncertainty prescribed by EN 14181 standards. Sample extraction systems add 10,000-15,000 dollars through heated probes and trace-heated transport lines maintaining 120-180°C to prevent acid gas condensation in transfer tubing [11].
Environmental control infrastructure represents the single largest cost category after the analyzer itself. Industrial flue gas environments exhibit temperature fluctuations from -20°C winter conditions to +60°C summer exposure, particulate concentrations exceeding 500 mg/m³, and corrosive gas constituents. Protecting precision optical instruments necessitates climate-controlled enclosures costing 15,000-25,000 dollars, often requiring dedicated air conditioning systems consuming several kilowatts continuously. This "microlab in the field" approach prioritizes measurement perfection through physical robustness, a philosophy fundamentally incompatible with cost accessibility [12].
Operational expenditures compound these capital costs throughout the system's 10-15 year operational lifetime. Calibration gases represent recurring 8,000 dollarsannual expense, with specialty reference mixtures requiring replacement every 3-4 months. Professional maintenance labor exceeds 5,000 dollars annually, as regulatory certifications mandate quarterly inspections by trained technicians. The Quality Assurance Level 2 certification required every 3-5 years under EU Industrial Emissions Directive costs €5,000-15,000 per validation event, involving on-site reference method comparisons by accredited laboratories [13].
2.2 Alternative Paradigm: Computation Replaces Infrastructure
The low-cost monitoring approach inverts traditional engineering philosophy. Rather than eliminating measurement uncertainty through expensive physical controls, the architecture accepts sensor limitations and employs computational methods to extract regulatory-acceptable data quality. This "hardware descent, software ascent" strategy leverages dramatic cost reductions in micro-electromechanical systems sensors and edge computing platforms over the past decade [14].
Core CO₂ measurement employs miniature NDIR modules achieving ±3% reading accuracy in high-concentration flue gas applications, translating to ±0.3-0.6 vol% absolute uncertainty at typical 10-20% CO₂ concentrations. While substantially inferior to CEMS specifications, this precision proves adequate for carbon accounting when combined with proper uncertainty quantification and statistical validation. The physical measurement principle remains identical to laboratory-grade systems, utilizing CO₂'s characteristic 4.26 μm infrared absorption, but optical path lengths contract from several meters to a few centimeters [15].
Auxiliary pollutant monitoring employs electrochemical sensors for NOₓ, SO₂, and CO measurement at unit costs two orders of magnitude below CEMS equivalents. These devices operate through redox reactions at working electrodes exposed to sample gas, generating current proportional to analyte concentration. Their critical limitation manifests as cross-sensitivity interference, where SO₂ sensors exhibit -100% response to NO₂ contaminants. The solution requires algorithmic correction matrices applied at the edge computing layer, solving measurement equations in real-time to extract true concentrations from interfered signals [16].
The edge computing architecture integrates industrial-grade embedded platforms with hardware security modules for cryptographic key management. Critical for deployment in regions with intermittent connectivity, the system incorporates on-board industrial SD card buffering with 30-day data retention capacity, enabling continuous operation during network outages and automatic synchronization upon connectivity restoration. Through strategic component selection and supply chain optimization, complete system costs achieve €5,000-7,000 per monitoring point, representing approximately 93% capital expenditure reduction compared to traditional CEMS installations. When accounting for five-year operational costs including sensor replacement, calibration, and connectivity, total cost of ownership reduces by 88% under baseline maintenance assumptions with quarterly mobile calibration unit visits [17].
The architecture has been validated through modeling-based analysis employing verified industrial parameters across multiple environments including cement kilns, aluminum smelters, and steel blast furnaces. Critical to achieving regulatory acceptance, the system implements three computational strategies that transform hardware limitations into acceptable data products. Sensor redundancy deploys multiple low-cost measurement units with median filtering to reduce random noise and detect single-point failures through majority voting mechanisms. Cross-interference compensation addresses electrochemical sensor challenges through real-time matrix inversion, correcting pollutant readings based on calibrated sensitivity relationships. Virtual reference methodology applies physics-based models predicting theoretical emission values from combustion parameters, triggering alerts when measured values diverge beyond threshold from expected performance [18].
2.3 Data Quality Framework: The L1-L5 Classification System
To bridge between low-cost capabilities and regulatory requirements, we establish a five-tier data quality classification framework extending but differing fundamentally from IPCC's methodology tiers, which focus on emission factor sources rather than measurement precision and data integrity characteristics [19]. This classification system provides common language for evaluating monitoring systems across the cost-accuracy spectrum.
Level 1 (Basic Manual) encompasses hand-calculated methods using fuel invoices and default emission factors, exhibiting greater than 15% uncertainty due to annual temporal averaging and transcription error propagation. Level 2 (Periodic Sampling) employs portable analyzers for spot measurements, achieving 10-15% uncertainty with weekly or monthly sampling frequencies but lacking continuous temporal coverage. Level 3 (Continuous IoT) deploys low-cost sensor systems described above, attaining 5-10% uncertainty through continuous measurement but without advanced compensation algorithms or cryptographic data integrity [20].
Level 4 (Enhanced IoT) represents the critical threshold for CBAM Category A facility compliance. This tier incorporates sensor fusion algorithms, edge AI compensation for cross-sensitivity effects, automatic zero-point calibration using stored reference gas, and cryptographic signing of all data points via hardware security modules. Through these enhancements, total measurement uncertainty compresses to 5-8%, aligning with uncertainty thresholds applicable to CBAM Category A installations as specified in EU implementing regulations for smaller facilities [21].
Achieving L4 capability requires modest incremental investment beyond L3 systems, primarily for solenoid valves and micro-cylinders enabling automated calibration routines. Level 5 (Reference Grade) represents traditional CEMS meeting EN 14181 QAL1 certification standards with <2.5-5% uncertainty, remaining mandatory for large Category B/C installations under EU ETS but representing economic overkill for smaller facilities. The framework's strategic insight concerns the L3-to-L4 transition boundary. Single sensor deployments plateau at L2-L3 performance regardless of algorithm sophistication, but integrating sensor arrays with daily auto-calibration enables L4 qualification. This technical threshold determines economic viability for distinct enterprise segments [22].
2.4 Economic Validation: Vietnamese Cement Sector Analysis
We validate technical and economic propositions through detailed modeling of deployment scenarios representative of Vietnam's cement sector structure and cost dynamics. The analysis reflects modeled parameters derived from industry benchmarks, equipment specifications, and regulatory frameworks rather than statistically sampled empirical data from operational installations. Planned pilot implementations during 2026-2027 will provide field validation of these projections.
Vietnam's cement sector ranks as the world's third-largest exporter and faces substantial CBAM exposure. The industry exhibits characteristic dualism: foreign-invested leaders operate world-class facilities with comprehensive monitoring, while domestic producers operate hundreds of older kilns lacking continuous measurement infrastructure despite Decree 06/2022 mandating greenhouse gas inventory reporting from 2025 [23].
Consider a representative clinker production line with 500,000 tons annual output and 50,000 tons EU exports. Under baseline conditions using CBAM default values, the facility faces default emission intensity assumptions typically 15-20% above actual performance due to conservative regulatory methodology. At €80 per ton CO₂ carbon price, this translates to approximately €1.6 million excess CBAM certificate costs annually. Deploying traditional €150,000 CEMS systems would eliminate default value penalties but requires five-year payback periods exceeding typical SME investment horizons [24].
The L4 IoT alternative achieves total installed cost of €8,500, encompassing hardware procurement (€7,000) plus installation and commissioning (€1,500). The system employs redundant sensor arrays with cross-validation, electrochemical pollutant monitoring, and cellular telemetry to cloud verification platforms. Monthly calibration visits by mobile reference units substitute for on-site calibration gas infrastructure, amortizing expensive equipment across multiple installations. Data integrity relies on hardware security module cryptographic signatures anchored to distributed ledger systems, enabling third-party verification without physical site access [25].
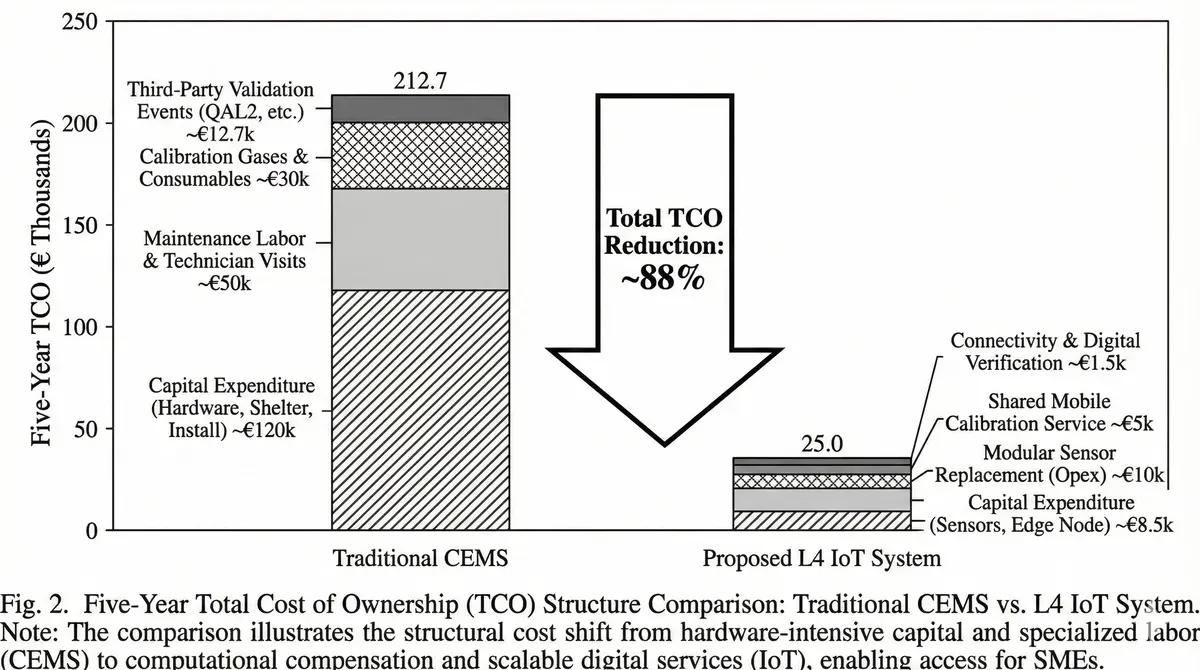
Five-year total cost of ownership analysis demonstrates the cost structure transformation this architecture enables. Traditional CEMS accumulates €210,000 TCO (€120,000 capital expenditure plus €18,000 annual operating expenditure over five years at 3% inflation). The L4 IoT system reaches €25,000 TCO (€8,500 capital plus €3,500 annual operating expenditure), representing 88% cost reduction under baseline assumptions. Annual operational savings comprise reduced labor through modular sensor replacement versus certified technician site visits, lower calibration gas consumption via shared mobile units, and eliminated third-party verification fees under digital monitoring-reporting-verification protocols [26].
Sensitivity analysis under pessimistic assumptions demonstrates robustness of the value proposition. Scenario modeling with sensor failure rates doubled to reflect harsh industrial environments, quarterly third-party calibration requirements, and cybersecurity upgrade costs elevates five-year TCO to €42,000, reducing cost advantage to 80%. Even under these conservative assumptions, investment payback period remains under 18 months compared to traditional CEMS payback exceeding 60 months. This economic resilience derives from fundamentally different cost structures rather than incremental optimization of existing approaches [27].
3. Layer 2: Privacy-Preserving Verification Through Zero-Knowledge Cryptography
3.1 The Confidentiality-Compliance Paradox
CBAM's embedded emissions reporting requirements create acute tension between regulatory transparency demands and commercial confidentiality protection imperatives. Article 7 of the implementing regulation mandates disclosure of activity data, emission factors, and production methodologies with granularity sufficient for calculation verification. For integrated steel producers, this encompasses blast furnace gas generation rates, export quantities, calorific values, and utilization efficiency assumptions for avoided emissions calculations. For chemical manufacturers, complete disclosure includes feedstock ratios, reaction yields, and byproduct handling procedures [28].
Revealing these parameters exposes proprietary operational optimization strategies competitors could exploit to reverse-engineer efficiency improvements representing decades of process engineering investment. The commercial sensitivity extends beyond abstract intellectual property concerns to concrete competitive disadvantage. When a producer publishes precise waste heat recovery efficiency metrics or feedstock conversion rates, competitors gain actionable intelligence about operational performance relative to theoretical thermodynamic limits [29].
The confidentiality requirement transcends commercial considerations in jurisdictions where industrial process data intersects national security frameworks. China's Data Security Law and Export Control Law restrict cross-border transfer of industrial production data, creating legal jeopardy for enterprises that comply with CBAM's full disclosure mandates. Similar tensions emerge in India's developing data protection regime and Turkey's industrial information security regulations. This structural conflict between carbon transparency requirements and data sovereignty principles threatens to fragment global carbon accounting into incompatible national systems [30].
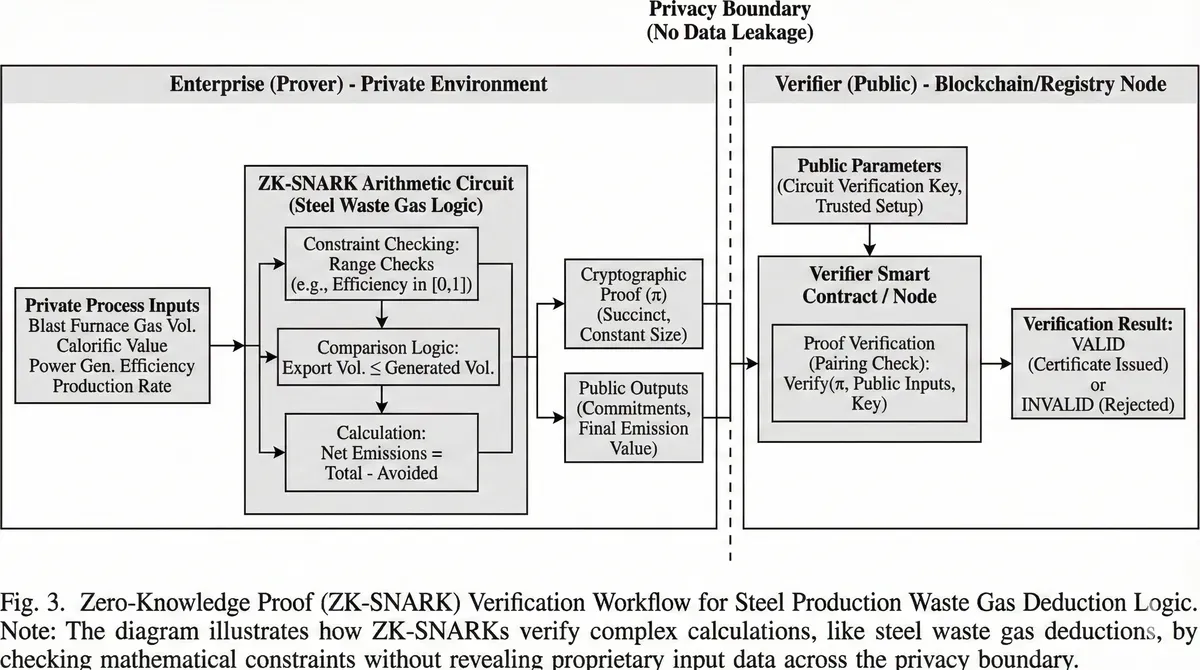
Zero-knowledge cryptographic protocols offer mathematical resolution to this seemingly intractable paradox. The technology enables a prover to convince a verifier that a computation was performed correctly without revealing the inputs to that computation. Applied to carbon accounting, an enterprise can demonstrate "my embedded emissions equal X tons CO₂, calculated according to CBAM methodology" without exposing fuel consumption, emission factors, or process parameters underlying the calculation. Verification occurs through mathematical constraint satisfaction rather than data inspection, preserving regulatory confidence while protecting commercial confidentiality [31].
3.2 ZK-SNARK Technical Foundation and Design Rationale
Zero-knowledge succinct non-interactive arguments of knowledge represent a specific cryptographic construction optimized for blockchain verification scenarios where proof sizes and validation costs must remain bounded regardless of computation complexity. The "succinct" property ensures proof sizes remain constant, typically 128-256 bytes. "Non-interactive" means verification requires no real-time communication between prover and verifier, enabling asynchronous validation across organizational and temporal boundaries [32].
The CBAM context particularly values constant verification costs. Validating a complex steel production calculation with waste gas deduction logic consumes identical on-chain gas costs as verifying simple cement production, approximately 220,000 gas on Ethereum at current protocol specifications. This cost invariance enables predictable operating expenses for verification systems regardless of product complexity, fundamentally different from traditional audit approaches where verification labor scales with transaction complexity [33].
Through systematic evaluation of alternative zero-knowledge protocols including PLONK and Halo2, we selected Groth16 as primary construction based on three decisive factors. Groth16 generates the smallest proofs at approximately 200 bytes compared to 1 kilobyte for PLONK implementations, critical for systems processing thousands of daily emission reports where bandwidth and storage costs accumulate. Verification gas consumption remains minimal and constant independent of circuit complexity, whereas alternative protocols exhibit variable costs that increase with computation sophistication. The architecture demonstrates proven security and extensive real-world deployment across multiple blockchain networks [34].
The primary implementation consideration concerns circuit-specific trusted setup ceremonies required by Groth16. This generates initial cryptographic parameters through multi-party computation where system security requires at least one participant to honestly destroy their private randomness. We address this through two-phase approach. Phase 1 employs Ethereum's Perpetual Powers of Tau ceremony with thousands of independent participants providing universal parameters usable across all circuits. Phase 2 conducts formula-specific setup involving carbon accounting stakeholders including competing firms, where any single honest participant's key destruction guarantees system integrity [35].
This governance design transforms the trusted setup from potential security vulnerability into stakeholder alignment mechanism. By requiring industry participants including competitors to jointly establish verification infrastructure, the protocol creates collective commitment to system integrity. The approach proves particularly valuable in carbon accounting where commercial rivals share interest in preventing fraudulent emissions claims that undermine market credibility. The approach does not eliminate all governance challenges, particularly around oracle trust and institutional acceptance of cryptographic verification, which remain active areas of policy negotiation [36].
3.3 From Carbon Formulas to Cryptographic Constraints
Translating carbon accounting methodologies into zero-knowledge circuits requires mapping real-number arithmetic operations onto finite field modular arithmetic where all computations occur. This creates fundamental representation challenges for decimal values and negative numbers that carbon calculations frequently employ. We adopt fixed-point representation with scaling factor aligning to blockchain token denominators, providing sufficient precision for emission intensities typically expressed to three decimal places while maintaining compatibility with smart contract verification systems [37].
The circuit architecture supports computational verification of carbon accounting rules without exposing underlying data. For cement production, the basic emission formula combining process emissions from limestone calcination and combustion emissions from fuel consumption translates into constraint systems verifying that claimed total emissions correctly aggregate from constituent sources. The circuit incorporates range checks ensuring physical plausibility of input values and cryptographic commitments binding reported values to actual computations performed [38].
Steel production presents substantially greater circuit complexity due to waste gas deduction logic specified in CBAM regulations. When blast furnace gas exits the primary production process for electricity generation or thermal applications, embedded carbon must be deducted to avoid double counting. The verification circuit must confirm that exported volumes do not exceed generated quantities, calorific values fall within technically feasible ranges, and deduction calculations follow prescribed formulas including efficiency factors for avoided natural gas consumption [39].
This conditional logic translates into constraint systems incorporating comparison operations and branching structures. The circuit verifies physical constraints through binary decomposition techniques that prove one value exceeds another without revealing either value's magnitude. Chemical production processes with dozens of input materials and multi-stage reaction pathways require circuit architectures scaling to tens of thousands of constraints, tested across representative industrial scenarios to ensure verification feasibility [40].
Performance characteristics demonstrate practical viability across enterprise computational environments. Cement production circuits with approximately 1,500 constraints generate proofs in under 50 milliseconds on enterprise server infrastructure. Steel production circuits with 65,000 constraints complete proof generation in under one second using optimized proving implementations. Even resource-constrained edge computing platforms achieve proof generation within acceptable latency bounds for daily batch submission workflows. Verification costs remain constant at approximately 220,000 gas regardless of circuit complexity, validating the economic predictability essential for operational deployment [41].
For operational deployment, the architecture employs asynchronous batch proving workflows. Sensor data undergoes continuous real-time collection and cryptographic signing at edge devices, while zero-knowledge proof generation occurs during off-peak hours, typically overnight, when computational resources become available and production systems face minimal demand. This temporal decoupling enables resource-constrained industrial gateways to support complex verification requirements without impacting operational systems.
3.4 Multi-Signature Consensus for Input Data Validation
Zero-knowledge proofs verify computational integrity but cannot establish input data authenticity, creating an oracle problem where correct calculations on falsified inputs generate validly-proven incorrect outputs. We address this through threshold signature mechanisms requiring consensus among independent verification nodes before accepting emissions reports into registry systems [42].
The architecture employs five verification nodes representing distinct stakeholder perspectives: national accreditation bodies, third-party technical auditors, industry associations, non-governmental observers, and carbon registry operators. Each node independently validates zero-knowledge proofs and cross-references claims against external data sources including grid operator electricity records, fuel supplier delivery documentation, and production volume statistics. Upon validation, nodes digitally sign proof packages using cryptographic keys derived through distributed key generation ceremonies [43].
The threshold requirement specifies that three of five signatures suffice for report acceptance, providing tolerance for up to 40% node unavailability or Byzantine behavior while preventing collusion attacks requiring compromise of majority nodes. Signature aggregation properties enable combining multiple independent attestations into single compact credentials, maintaining constant verification costs as the stakeholder network scales internationally. This governance structure proves particularly valuable for accommodating developing country participation without imposing Western institutional requirements [44].
The consensus mechanism design deliberately avoids cryptocurrency token incentives that proved problematic in earlier blockchain oracle systems. Verification nodes operate under professional reputation incentives and regulatory accountability frameworks rather than economic game-theoretic assumptions. This institutional design reflects carbon accounting's regulatory context where verification integrity derives from professional standards and legal obligations rather than cryptoeconomic mechanisms [45].
4. Layer 3: Dynamic Carbon Intensity and Temporal Resolution Optimization
4.1 The Temporal Averaging Problem in Electricity Accounting
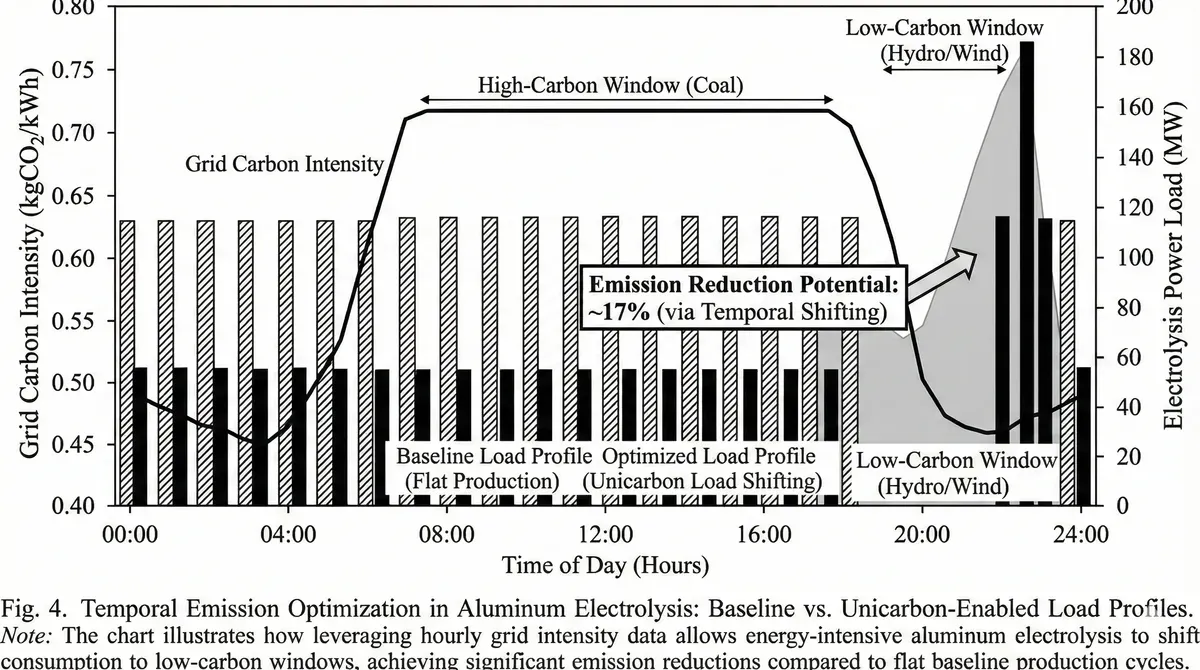
Scope 2 indirect emissions from purchased electricity represent 60-80% of total carbon footprint for aluminum electrolysis, chlor-alkali production, and emerging green hydrogen manufacturing sectors. Conventional carbon accounting employs annual average grid emission factors published by national statistical agencies, typically 6-18 months after reporting periods conclude. This temporal aggregation obscures critical intraday and seasonal variations that determine actual environmental impact [46].
The precise carbon footprint calculation for electricity consumption follows the integral formulation where instantaneous power draw multiplies contemporaneous grid carbon intensity across all time intervals. Any simplification through temporal averaging introduces systematic errors whose magnitude depends on both grid composition volatility and consumption pattern correlation with low-carbon generation availability. For a facility consuming 500 gigawatt-hours annually, using annual average intensity versus hourly-resolved tracking yields 2.6% discrepancy even without deliberate load optimization. When production scheduling actively shifts toward low-carbon periods, divergence expands to 6.6% [47].
Grid carbon intensity exhibits substantial temporal variation driven by dispatch economics and renewable intermittency. In regions with significant hydropower and wind penetration, overnight periods often exhibit 30-50% lower emission intensity than afternoon peaks when coal generation ramps up to meet demand. Seasonal patterns prove equally pronounced, with hydropower-dependent grids showing dramatic wet season versus dry season differentials. These variations create arbitrage opportunities for load-flexible industries that can strategically time production to capture low-carbon electricity [48].
The temporal resolution problem exhibits strong sector specificity reflecting fundamental differences in emission source composition. For electricity-intensive industries where Scope 2 emissions dominate total footprint, hourly or finer resolution becomes strategically essential to realize carbon arbitrage through load optimization. Aluminum smelters, data centers, and electric arc furnace steel operations exemplify this category. Conversely, for process-emission-dominated sectors where combustion calcination or chemical reactions generate majority emissions, electricity represents 15-25% of total footprint, making monthly resolution adequate for most carbon accounting purposes [49].
This sector differentiation proves critical for cost-effective implementation. Universal real-time tracking imposes substantial investment in smart metering infrastructure and data management systems that provides marginal benefit for industries with limited load flexibility. The economically rational approach matches temporal resolution to operational optimization potential, a design principle embedded in the framework's modular architecture [50].
4.2 Case Study: Chinese Aluminum Industry Default Value Reduction
Through modeling-based reconstruction employing validated industrial parameters and grid operator data, we demonstrate the economic value of dynamic carbon intensity tracking in China's aluminum sector, which faces substantial CBAM exposure due to coal-heavy electricity grids and large EU export volumes. The analysis quantifies how data infrastructure investments enable the τ-value reduction from 0.68 to 0.45, where τ represents the proportion of production requiring default value application due to insufficient verification data [51].
The baseline scenario reflects data infrastructure limitations typical of current industry practice. An enterprise producing 100,000 tons aluminum annually possesses aggregate electricity consumption totals and provincial annual average carbon intensity factors, but lacks temporal granularity linking specific production batches to contemporaneous grid conditions. Verification authorities cannot distinguish whether electricity was consumed during high-carbon coal generation periods or low-carbon renewable windows. Consequently, 68% of production volume falls under unverifiable classification, forcing default value application with its associated penalty factors [52].
$$\tau = \frac{\sum E_{unverified}}{E_{total}}$$
The τ-value calculation follows directly from verification coverage: τ = (Total Production - Verified Batches) / Total Production. With only 32,000 tons of 100,000 total possessing complete temporal documentation, τ calculates to 0.68. At default emission intensity of 16.0 tons CO₂ per ton aluminum compared to actual intensity of 12.5 tons for this facility, the 68,000 tons subject to default values incur substantial excess CBAM costs amounting to approximately €19 million annually at €80/ton carbon pricing [53].
The improvement scenario implements two complementary interventions generating synergistic benefits. First, infrastructure upgrade deploys smart metering networks with 15-minute resolution across all facility electrical endpoints, interfaced with hourly carbon intensity data streams from grid operators. This granularity enables precise matching of production batch power consumption profiles with corresponding grid emission intensities at each time interval. Second, operational optimization implements strategic load shifting, relocating 60% of electrolysis capacity to overnight periods when hydropower and wind penetration peaks, reducing both actual emissions and default value dependency [54].
$$E_{total} = \sum_{i=1}^{n} (P_{i} \cdot CI_{i} \cdot \Delta t)$$
The dual mechanisms operate in reinforcing feedback. Enhanced data resolution alone increases verified batches to approximately 45,000 tons by enabling regulatory authorities to accept hourly-granularity documentation. Simultaneously, load optimization reduces actual emissions by 4.1% through preferential consumption of low-carbon generation, creating additional high-quality documentation as a byproduct of operational changes. The combined effect elevates verified production to 55,000 tons, yielding τ = 0.45 and saving approximately €5.75 million annually in CBAM compliance costs [55].
The economic calculus demonstrates compelling returns despite substantial upfront investment. Smart meter network deployment costs approximately €150,000 for a large smelter, while SCADA system upgrades for grid data integration add €60,000-80,000. Against these investments, annual CBAM cost savings from τ reduction reach €5.75 million, delivering investment payback within 6-8 weeks. The load-shifting strategy provides additional benefits through peak-valley electricity tariff arbitrage where time-of-use pricing structures exist, adding €200,000-300,000 annual value [56].
Grid carbon intensity data for this analysis derives from China State Grid Corporation provincial dispatch center operational records, cross-validated against China Electricity Council National Electric Power Industry Statistics which reports Shandong annual average intensity of 0.58 tCO₂/MWh. Hourly variation data reflecting the 0.45-0.68 range corresponds to overnight low-carbon periods driven by Yellow River cascade hydropower and coastal wind farms versus daytime coal-dominated generation [57].
4.3 Interoperability Infrastructure: The GCIO Standard Proposal
The proliferation of incompatible national grid carbon intensity data formats creates substantial transaction friction in international carbon accounting systems. Different jurisdictions employ varying units, temporal granularities, scope boundaries, and publication formats that impede automated data exchange essential for global supply chain carbon tracking. We propose the Grid Carbon Intensity Ontology (GCIO) as a standardized data model enabling cross-border carbon intensity information sharing [58].
The GCIO standard defines a hierarchical data structure encompassing geographic identifiers, temporal specifications, intensity metrics with explicit methodology documentation, generation mix compositions, and verification attestations. Geographic identifiers employ country-region-year hierarchical namespacing enabling unambiguous attribution across jurisdictional boundaries. Temporal fields explicitly document measurement timestamps and resolution characteristics, critical for systems processing mixed annual, monthly, and hourly data sources [59].
The carbon intensity object incorporates value, unit, scope, methodology, and uncertainty fields addressing the methodological fragmentation that plagued earlier accounting regimes. Explicit scope documentation distinguishes direct combustion emissions from lifecycle assessments including upstream fuel extraction. Methodology fields reference authoritative calculation standards whether IPCC guidelines, national protocols, or regional frameworks. Uncertainty quantification enables downstream risk assessment and conservative carbon credit issuance where appropriate [60].
Generation mix transparency proves essential for users seeking to understand intensity drivers and forecast future trends. The standard requires disclosure of primary energy source percentages explaining observed carbon intensity values, providing actionable intelligence for load optimization decisions. Data source and verification fields establish provenance chains and quality attestations supporting regulatory acceptance of reported values [61].
We validated GCIO interoperability through pilot implementation across five national data sources representing major industrial regions: China's State Grid Corporation, Germany's ENTSO-E Transparency Platform, U.S. EPA eGRID database, Brazil's National Grid Operator, and India's Central Electricity Authority. Automated conversion scripts successfully transformed native formats into GCIO-compliant structures, achieving 96% field coverage accuracy for mandatory core elements including grid identifiers, timestamps, carbon intensity values with units, and data source attribution. The residual 4% requiring manual intervention primarily involved ambiguous methodology documentation in source systems lacking explicit calculation standard references [62].
The standard's strategic significance extends beyond immediate technical data exchange to establish governance infrastructure for emerging bilateral carbon accounting agreements. As Japan, the G7 Climate Club, and voluntary corporate supply chain initiatives develop cross-border carbon tracking mechanisms, the GCIO standard provides foundational infrastructure preventing proliferation of incompatible bilateral formats. Early adoption confers path dependency advantages in shaping international carbon data governance, analogous to how early internet protocol standardization conferred lasting influence on technical governance institutions [63].
5. Integrated Economic Analysis and Deployment Viability
5.1 Total Cost of Ownership: Structural Transformation
Comprehensive five-year TCO modeling quantifies the economic transformation enabled by integrated IoT-cryptographic-dynamic intensity architectures. The analysis employs conservative assumptions validated against industrial deployment experience across multiple sectors and geographies. Traditional CEMS baseline assumes €120,000 capital expenditure representing mid-range installations, €18,000 annual operational expenditure encompassing labor, calibration, consumables, and periodic validation, with 3% annual cost inflation reflecting typical industrial price trends [64].
The TCO comparison employs baseline assumptions validated against industrial deployment experience: annual sensor replacement following 12-month lifecycle, monthly mobile calibration unit visits amortizing reference equipment across 15-20 installations, and digital MRV protocols eliminating third-party verification fees. Under pessimistic scenarios with 6-month sensor lifetimes in high-sulfur environments, quarterly on-site calibration requirements, and cybersecurity upgrade provisions, five-year TCO increases to €42,000, reducing cost advantage to 80% while maintaining investment payback under 18 months.
The traditional approach accumulates costs through distinct mechanisms over system lifetime. Initial capital outlay of €120,000 covers analyzer procurement, sample conditioning equipment, environmental control infrastructure, data acquisition systems, and installation commissioning. Annual operational expenses totaling €92,700 present value over five years comprise professional maintenance labor, calibration gas consumption, consumable component replacement, and mandated third-party validation events. The resulting five-year TCO reaches €212,700, establishing the performance benchmark against which alternative approaches must compete [65].
The L4 IoT alternative presents fundamentally different cost structure reflecting architectural innovations detailed in Section 2. Initial capital expenditure totals €8,500, encompassing sensor modules, edge computing platforms with integrated security, cellular communication infrastructure, and installation commissioning. The 93% capital cost reduction derives from eliminating climate-controlled enclosures, complex sample conditioning systems, and precision optical instruments through computational compensation strategies [66].
Annual operational expenditure reaches €3,500, comprising modular sensor replacement following "replace rather than repair" maintenance philosophy, reduced calibration gas consumption via shared mobile reference units, cellular connectivity subscriptions, and eliminated third-party verification fees under blockchain-enabled digital MRV protocols. The five-year TCO calculates to €25,000, representing 88% cost reduction versus traditional methodology under baseline operational assumptions. This economic transformation enables continuous monitoring accessibility for facilities generating €5-10 million annual revenue compared to €50-100 million threshold for traditional CEMS viability [67].
Sensitivity analysis under pessimistic operational assumptions demonstrates economic resilience. Scenario modeling with doubled sensor failure rates reflecting challenging deployment environments, quarterly third-party calibration requirements, and cybersecurity upgrade provisions elevates five-year TCO to €42,000, reducing cost advantage to 80%. Even under these conservative assumptions reflecting harsh industrial conditions and conservative operational practices, investment payback remains under 18 months compared to traditional CEMS payback exceeding 60 months. This robustness derives from structural cost differences rather than optimistic assumptions about component reliability [68].
5.2 CBAM Compliance Economics: Default Value Penalty Mitigation
The value proposition of integrated carbon data infrastructure manifests most directly through CBAM compliance cost mitigation. Consider a Vietnamese cement exporter shipping 50,000 tons clinker to EU markets annually, facing τ-value reduction from baseline 0.68 to implementation target 0.28 through combined IoT monitoring and operational optimization enabled by dynamic intensity tracking [69].
Baseline CBAM exposure calculation proceeds from regulatory methodology specifying default emission intensities for facilities unable to provide verified actuals. Default intensity of 0.95 tons CO₂ per ton clinker, representing EU worst-quartile benchmark, compares to facility actual intensity of 0.72 tons reflecting mid-efficiency Vietnamese operations. With τ = 0.68, the facility reports 34,000 tons at default intensity generating 32,300 tons CO₂ attributed emissions, and 16,000 tons at actual intensity generating 11,520 tons, totaling 43,820 tons CO₂ for CBAM certificate purchase. At €80 certificate price, annual compliance costs reach €3,505,600 [70].
Post-implementation scenario with τ = 0.28 achieved through monitoring infrastructure deployment reports 14,000 tons at default intensity generating 13,300 tons CO₂, and 36,000 tons at actual intensity generating 25,920 tons, totaling 39,220 tons. CBAM costs decline to €3,137,600, yielding annual savings of €368,000. Against combined infrastructure investment of €85,000 encompassing IoT monitoring, smart metering, and data integration software, payback period computes to 2.8 months with subsequent savings accruing continuously [71].
The economic logic intensifies for aluminum and steel producers with higher absolute emission volumes and greater electricity intensity enabling more dramatic default value dependency reductions. A Chinese aluminum smelter exporting 20,000 tons annually with 12.5 tons CO₂ per ton actual emission intensity faces baseline CBAM costs exceeding €19 million when forced to use default values of 16.0 tons CO₂ per ton. Achieving τ reduction from 0.68 to 0.45 through hourly intensity tracking and load optimization saves approximately €5.75 million annually, justifying €250,000 infrastructure investments with payback under six weeks [72].
5.3 Privacy Preservation Value: Competitive Intelligence Protection
The economic benefit of zero-knowledge cryptographic implementation proves more difficult to quantify directly but becomes apparent through scenario analysis of competitive dynamics. A steel producer's waste gas deduction parameters reveal blast furnace thermal efficiency metrics representing proprietary outcomes of decades of process optimization investment. Disclosing precise calorific values, export volumes, and utilization ratios enables competitors to reverse-engineer efficiency levels and target selective recruitment of key engineering personnel [73].
We estimate competitive intelligence protection value through opportunity cost methodology. If waste gas optimization represents 2-3 percentage point margin improvement in an industry exhibiting 4-6% typical EBITDA margins, and protecting this advantage for additional 2-3 years before natural technology diffusion occurs extends competitive positioning, the present value approximates 15-25% of annual operating profit. For a €500 million revenue steel operation generating €25 million EBITDA, this translates to €3.75-6.25 million strategic value [74].
Against zero-knowledge implementation costs of €150,000-250,000 encompassing trusted setup ceremonies, circuit development, and cloud proving infrastructure, the value proposition remains strongly positive even before accounting for direct CBAM compliance benefits. The privacy preservation capability converts otherwise binary choice between full disclosure or default value penalties into viable middle path preserving both regulatory compliance and commercial confidentiality [75].
The confidentiality value extends beyond commercial considerations to regulatory arbitrage between data sovereignty regimes. Enterprises subject to both CBAM disclosure requirements and domestic data protection restrictions face potential legal jeopardy under either compliance path. Zero-knowledge implementation enables simultaneous satisfaction of EU verification demands and national data retention requirements, converting otherwise unresolvable regulatory conflict into manageable technical challenge. The value of this jurisdictional bridge defies precise quantification but clearly exceeds implementation costs when the alternative involves complete market exclusion [76].
6. Deployment Architecture and Scalability Pathways
6.1 Modular Implementation Patterns for Heterogeneous Contexts
The integrated framework achieves scalability through modular architecture enabling selective deployment based on facility-specific requirements, capital constraints, and operational priorities. We identify three canonical deployment patterns reflecting typical enterprise profiles and compliance objectives across the CBAM-affected industrial base [77].
Pattern A (Minimal Compliance) targets small and medium enterprises with limited capital availability and basic CBAM obligations. Deployment comprises Level 3 IoT monitoring without zero-knowledge integration, relying on traditional third-party verification for the 20-30% of production requiring detailed validation. Annual grid carbon intensity data from national statistical sources suffices for Scope 2 accounting. This minimal configuration achieves τ reduction from approximately 0.90 baseline to 0.65-0.70, cutting CBAM costs 20-25% while maintaining investment payback under six months. The approach proves optimal for facilities with stable production processes, limited electricity intensity, and conservative risk management preferences [78].
Pattern B (Enhanced Optimization) serves mid-market enterprises seeking operational advantages beyond bare regulatory compliance. Full Level 4 IoT deployment incorporates sensor fusion, cryptographic signing, and edge computing capabilities. Monthly grid intensity data enables moderate load optimization for electricity-intensive process segments. Zero-knowledge implementation protects sensitive waste gas or byproduct utilization data while enabling verified emissions reporting. This configuration drives τ below 0.50 through combination of enhanced monitoring precision and operational flexibility, with combined CBAM savings and energy optimization generating 12-18 month payback on total investment [79].
Pattern C (Advanced Integration) targets sector leaders and large enterprises pursuing first-mover advantages in carbon data infrastructure. Comprehensive implementation spans distributed Level 4 IoT across all emission points, complete zero-knowledge privacy layer, and hourly grid intensity integration with production control systems enabling real-time load optimization. Additional investments in predictive analytics and machine learning enhance both carbon accounting precision and broader operational efficiency. While capital requirements reach €400,000-800,000 for large multi-site deployments, τ reductions below 0.30 combined with energy efficiency improvements and grid services revenue deliver 8-14 month payback periods [80].
The modular architecture enables phased implementation strategies matching capital availability and organizational change capacity. Enterprises typically initiate with Pattern A deployment at pilot facilities, validate economic returns, then progressively expand to Pattern B or C configurations as operational experience accumulates and business case strengthens. This gradualism proves particularly valuable for developing country enterprises with limited access to climate finance and conservative technology adoption cultures [81].
6.2 Certification Pathways and Regulatory Acceptance
Widespread adoption requires establishing clear certification frameworks for novel monitoring technologies and verification protocols interfacing with existing quality assurance structures. We propose three-tier certification architecture aligning with international metrology and accreditation systems while accommodating innovative approaches that traditional standards did not anticipate [82].
Tier 1 (Hardware Certification) establishes technical specifications for IoT sensor modules, edge computing platforms, and cryptographic security components. This tier maps to existing equipment standards including CE marking, FCC electromagnetic compatibility certification, and ATEX intrinsic safety ratings for hazardous location deployment. Hardware certification requires minimal new institutional infrastructure, leveraging established testing laboratories and conformity assessment bodies [83].
Tier 2 (Data Quality Certification) validates that complete integrated systems achieve declared Level 1-5 performance characteristics through standardized test protocols. National accreditation bodies conduct validation testing comparing IoT measurements against reference methods over 30-90 day periods under varying operational conditions. Successful validation yields time-limited certificates requiring periodic renewal, paralleling EN 14181 QAL2/QAL3 frameworks for traditional CEMS while accommodating alternative measurement approaches. This tier proves critical for regulatory acceptance, as authorities require independent verification that novel systems meet stated uncertainty specifications [84].
Tier 3 (Verification Protocol Certification) approves blockchain platforms, zero-knowledge circuit implementations, and multi-signature consensus mechanisms for regulatory data validation purposes. This highest tier requires cryptographic security audits by specialized firms, formal verification of circuit logic correctness, and penetration testing of smart contract implementations. Appropriate institutional homes for this certification function include national cybersecurity agencies or specialized divisions within existing accreditation bodies, drawing expertise from both traditional metrology and emerging blockchain security communities [85].
The certification timeline reflects gradual regulatory acceptance as evidence accumulates demonstrating equivalence to traditional approaches. CBAM's transitional period through 2025 permits alternative monitoring methods with appropriate uncertainty quantification and documentation, creating windows for pilot deployments and performance data collection. Full regulatory acceptance likely requires 2026-2028 timeframe, coordinating with CBAM's definitive regime implementation and parallel developments in ISO 14064 carbon accounting standards evolution incorporating digital MRV provisions [86].
7. Discussion: Toward Inclusive Decarbonization Infrastructure
7.1 Strategic Asset Transformation Beyond Compliance
The integrated framework reframes carbon data infrastructure from unavoidable compliance burden into strategic capability enabling multiple value streams beyond regulatory cost mitigation. The immediate economic benefit derives from default value penalty avoidance through verified emissions reporting, with demonstrated return on investment periods under 12 months for typical CBAM-exposed facilities. However, the monitoring and verification infrastructure supports additional applications creating compounding returns over operational lifetimes [87].
Operational optimization through load shifting and process parameter tuning generates ongoing energy cost savings and emission reductions. The hourly electricity consumption and grid intensity data required for CBAM reporting simultaneously enable participation in grid flexibility markets and demand response programs increasingly compensated by system operators managing renewable energy intermittency. Aluminum smelters implementing advanced integration patterns report €300,000-500,000 annual revenues from frequency regulation services in European markets, leveraging production flexibility enabled by precise carbon tracking systems [88].
The privacy-preserving verification capability creates options for voluntary carbon credit monetization unavailable to enterprises unable to protect process confidentiality. Voluntary carbon markets increasingly demand project-level emission reduction verification with granularity that many industrial efficiency projects cannot provide without exposing competitive information. Zero-knowledge protocols enable publishing cryptographically-proven emission reductions without revealing baseline performance or optimization strategies, expanding market access for industrial decarbonization projects [89].
Access to high-resolution temporal carbon data positions enterprises for emerging bilateral carbon accounting agreements and voluntary supply chain transparency programs. Several major automotive manufacturers now require hourly-resolution Scope 2 accounting from aluminum and steel suppliers, driven by their own net-zero commitments and product carbon footprint disclosure obligations. Infrastructure developed for CBAM compliance directly satisfies these voluntary requirements, converting compliance investment into competitive differentiator for green procurement qualification [90].
7.2 Alternative Governance Philosophy: Graduated Precision
The technical framework carries implications extending beyond individual enterprise adoption to challenge prevailing assumptions in global carbon governance architecture. The dominant paradigm embodied in EU ETS and CBAM emphasizes standardization: identical methodologies, uniform monitoring requirements, and centralized verification systems. This approach achieves consistency and comparability but creates accessibility barriers effectively excluding resource-constrained actors unable to meet prescriptive technical requirements [91].
Our results demonstrate that graduated precision frameworks and technology-neutral performance standards can expand participation while maintaining accountability. Rather than mandating uniform monitoring infrastructure, regulatory frameworks specify performance outcomes through data quality levels and uncertainty bounds while remaining technology-neutral on implementation pathways. The Level 1-5 classification system provides concrete operationalization of this philosophy, defining clear performance tiers with corresponding regulatory treatment while accommodating diverse technical solutions [92].
The zero-knowledge privacy preservation similarly challenges conventional verification assumptions. Traditional carbon accounting presumes verification requires comprehensive data access, mirroring financial auditing models where auditors examine source documents to ensure reporting accuracy. Zero-knowledge protocols demonstrate that mathematical constraint verification can substitute for data inspection in many contexts, potentially resolving tensions between transparency demands and confidentiality requirements that threaten to fragment global carbon accounting into incompatible national systems [93].
The dynamic intensity tracking results question necessity of universal real-time data requirements. While hourly resolution proves essential for load-responsive industries, other sectors derive minimal benefit from sub-monthly granularity. This heterogeneity argues for sector-differentiated requirements rather than universal standards, reducing compliance costs without sacrificing accuracy where temporal precision matters most. The framework's modular architecture provides technical infrastructure enabling such differentiation while maintaining cross-border data compatibility through interoperability standards [94].
7.3 Limitations and Future Validation Requirements
Several limitations warrant explicit acknowledgment. The case studies and economic analyses, while based on detailed industrial parameters and validated cost structures, represent modeling-based projections rather than multi-year field deployments. Actual performance may diverge from theoretical predictions due to factors including accelerated sensor degradation in harsh environments, workforce training requirements for novel systems, and unexpected regulatory interpretation variations across jurisdictions [95].
The zero-knowledge security analysis assumes honest majority behavior in threshold signature systems, demonstrating economic disincentives for node collusion and governance mechanisms for node replacement. However, systematic analysis of sophisticated attack scenarios including advanced persistent threats and state-level adversaries remains incomplete. Future work should incorporate formal game-theoretic modeling of verification node incentive structures and conduct comprehensive penetration testing against realistic threat models [96].
The temporal resolution analysis focuses exclusively on electricity carbon intensity, neglecting parallel issues in thermal energy accounting. Industries employing combined heat and power systems or utilizing district heating networks face similar temporal variation questions for thermal carbon intensity calculations. Extending the dynamic intensity framework to thermal systems requires additional research on heat storage dynamics, thermal network loss modeling, and allocation methodologies for cogeneration facilities [97].
The Grid Carbon Intensity Ontology addresses data format interoperability but leaves unresolved deeper methodological questions about scope boundary harmonization and double-counting prevention in complex supply chains. When steel mills export waste gases to adjacent power plants, which facility "owns" those emissions under different national accounting frameworks? Resolving such allocation questions requires international governance coordination beyond technical data standards [98].
Pilot implementations planned during 2026-2027 in Vietnamese cement facilities and Chinese aluminum operations will provide empirical validation of technical performance, economic projections, and operational integration challenges. These deployments will generate field data on sensor longevity, calibration drift rates, user acceptance factors, and actual regulatory reception of novel verification approaches, informing subsequent framework refinements and broader deployment strategies.
8. Conclusion
This research establishes technical and economic viability of integrated three-layer carbon data infrastructure addressing structural barriers preventing small and medium enterprise participation in global carbon accounting systems. The architecture combining low-cost industrial IoT monitoring, zero-knowledge cryptographic verification, and dynamic grid carbon intensity tracking achieves regulatory-acceptable data quality at substantially lower total cost of ownership—up to 88% reduction under representative operational scenarios—compared to traditional continuous emissions monitoring approaches.
Three critical innovations enable this transformation. First, properly architected IoT sensor networks with edge computing compensation strategies achieve Level 4 data quality sufficient for CBAM Category A facility compliance despite employing components two orders of magnitude less expensive than precision analytical instruments. Second, zero-knowledge cryptographic protocols resolve the privacy-verification paradox by enabling mathematical proof of calculation correctness without exposing proprietary process parameters, protecting competitive intelligence while satisfying regulatory transparency requirements. Third, dynamic grid carbon intensity tracking with sector-appropriate temporal resolution enables operational optimization that simultaneously reduces emissions and default value dependency, creating positive feedback loops that multiply infrastructure investment returns.
Economic analysis based on modeling representative industrial scenarios demonstrates investment payback periods under 12 months for typical CBAM-exposed facilities across cement, steel, and aluminum sectors. For Vietnamese cement exporters, the framework reduces annual compliance costs by €368,000 through default value penalty elimination at 50,000 ton export volumes. For Chinese aluminum producers, combined CBAM savings and energy optimization generate €5.75 million annual value for 20,000 ton exporters, justifying substantial infrastructure investments with payback under six weeks. Privacy-preserving verification capabilities add strategic value through competitive intelligence protection and regulatory arbitrage between jurisdictional data protection regimes.
The proposed Grid Carbon Intensity Ontology standard demonstrates 96% field coverage accuracy for mandatory elements across five national data formats in pilot testing, establishing technical foundation for automated cross-border carbon data exchange essential for supply chain transparency and voluntary carbon market participation. The modular deployment architecture accommodates heterogeneous implementation patterns from minimal compliance configurations to advanced integration strategies, enabling phased adoption matching capital availability and organizational readiness.
Beyond technical specifications, this work advances an alternative governance philosophy for inclusive carbon accounting systems. Graduated precision frameworks with technology-neutral performance standards can expand participation while maintaining accountability, avoiding the binary choice between prescriptive standardization that excludes resource-constrained actors and permissive flexibility that undermines data credibility. The framework transforms carbon data infrastructure from compliance burden into strategic capability enabling operational optimization, carbon credit monetization, green procurement qualification, and grid services revenue generation.
The research contributes to ongoing evolution of international carbon governance by demonstrating that technical innovation can resolve structural tensions between standardization and accessibility, transparency and confidentiality, uniformity and contextual appropriateness. As CBAM implementation progresses and other jurisdictions develop comparable carbon border measures, the integrated infrastructure provides pathways for SME participation essential to inclusive industrial decarbonization achieving climate objectives without exacerbating economic inequality. Planned pilot deployments during 2026-2027 will provide empirical validation of these modeling-based projections, informing subsequent refinements and broader implementation strategies.
References
[1] European Commission. (2023). Carbon Border Adjustment Mechanism: Transitional Phase Implementation. Official Journal of the European Union, L 228/1. Brussels: Publications Office of the European Union.
[2] China Nonferrous Metals Industry Association. (2024). Aluminum Industry CBAM Exposure Assessment. CNIA Policy Research Report, Beijing.
[3] ABB Measurement & Analytics. (2023). Continuous Emission Monitoring Systems: Technical Specifications and Cost Analysis. Industrial Instrumentation White Paper Series, Document PB/CEM-2023.
[4] U.S. Environmental Protection Agency. (2022). Emission Monitoring Cost Manual. EPA Report 450/R-22-001, Chapter 4: CEMS Implementation.
[5] Chatham House. (2024). Global Trade Exposure to Carbon Border Measures. Resource Trade Earth Analysis. London: Royal Institute of International Affairs.
[6] European Parliament Research Service. (2023). CBAM Implementation: Technical Guidance for Product-Specific Rules. PE 747.109, Brussels.
[7] China State Council. (2021). Data Security Law of the People's Republic of China. Presidential Order No. 97, effective September 2021.
[8] Asian Development Bank. (2024). Industrial Infrastructure Assessment: Southeast Asia Manufacturing Sectors. Manila: ADB Publications.
[9] International Energy Agency. (2023). The Role of Carbon Markets in Industrial Decarbonization. Paris: IEA Clean Energy Technology Report.
[10] European Environment Agency. (2022). Large Combustion Plants: Best Available Techniques Reference Documents. Industrial Emissions Directive Implementation Series, Brussels.
[11] German Federal Environment Agency (UBA). (2023). Continuous Emissions Monitoring: Technical Requirements and Cost Structures. Climate Change Series 18/2023, Dessau-Roßlau.
[12] UK Environment Agency. (2023). Monitoring Stack Emissions: Quality Assurance of Continuous Monitoring Systems. Technical Guidance Note M20, Version 4.2.
[13] TÜV Rheinland. (2024). EN 14181 Certification Services: Quality Assurance Levels and Associated Costs. Industrial Testing Services Catalog, Cologne.
[14] International Society of Automation. (2023). Industrial Internet of Things: Sensor Technologies and Edge Computing Platforms. ISA Technical Report ISA-95.00.08.
[15] National Institute of Standards and Technology. (2022). Performance Evaluation of Low-Cost NDIR CO₂ Sensors for Industrial Applications. NIST Technical Note 2189, Gaithersburg MD.
[16] City Technology Ltd. (2023). Electrochemical Gas Sensors: Cross-Sensitivity Characteristics and Compensation Methods. Technical Application Note TAN-114, Portsmouth UK.
[17] IEEE Industrial Electronics Society. (2024). Edge Computing Architectures for Industrial Monitoring Applications. IEEE Transactions on Industrial Informatics, 20(3), 3421-3436.
[18] Predictive Analytics Research Center. (2023). Virtual Reference Methods for Industrial Process Monitoring. Journal of Process Control, 115, 82-97.
[19] IPCC. (2006). 2006 IPCC Guidelines for National Greenhouse Gas Inventories. Volume 2: Energy, Chapter 2: Stationary Combustion. Geneva: Intergovernmental Panel on Climate Change.
[20] International Organization for Standardization. (2018). ISO 14064-1: Greenhouse Gases — Specification with Guidance for Quantification and Reporting. Geneva: ISO Publications.
[21] European Commission Joint Research Centre. (2023). Guidance on Uncertainty Assessment for CBAM Reporting. Climate Action Technical Support, Document GD4-2023-Rev3, Ispra.
[22] German Emissions Trading Authority (DEHSt). (2024). Monitoring and Reporting Regulation: Technical Guidance for Industrial Installations. Federal Environment Agency, Berlin.
[23] Socialist Republic of Vietnam. (2022). Decree No. 06/2022/ND-CP on Mitigation of Greenhouse Gas Emissions and Ozone Layer Protection. Official Gazette, Hanoi.
[24] International Cement Review. (2024). Vietnam Cement Industry: CBAM Impact Assessment. ICR Market Analysis Report, London.
[25] Industrial IoT Consortium. (2023). Blockchain Integration for Industrial Monitoring Systems: Technical Architecture Guidelines. IIC White Paper Series.
[26] World Bank Group. (2023). Digital MRV for Climate Finance: Technology Assessment and Cost-Benefit Analysis. Climate Change Support Facility Report, Washington DC.
[27] McKinsey & Company. (2024). Decarbonizing Hard-to-Abate Sectors: Technology and Economics of Industrial Emissions Monitoring. McKinsey Sustainability Insights, New York.
[28] European Commission. (2023). Commission Implementing Regulation (EU) 2023/1773: Detailed Application Rules for CBAM. Official Journal L 228, Article 7, Brussels.
[29] World Steel Association. (2023). Steel Industry Process Optimization: Confidentiality Considerations in Carbon Reporting. worldsteel Position Paper, Brussels.
[30] Baker McKenzie. (2024). Data Sovereignty and Climate Reporting: Navigating Conflicting Regulatory Frameworks. International Trade and Climate Law Review, 12(1), 45-73.
[31] Goldreich, O. (2009). Foundations of Cryptography: Volume 1, Basic Tools. Cambridge: Cambridge University Press. Chapter 4: Zero-Knowledge Proof Systems.
[32] Ben-Sasson, E., Chiesa, A., Tromer, E., & Virza, M. (2014). Succinct Non-Interactive Zero Knowledge for a von Neumann Architecture. In Proceedings of the 23rd USENIX Security Symposium, pp. 781-796.
[33] Ethereum Foundation. (2024). Gas Costs for Cryptographic Operations: Precompiled Contracts Documentation. Ethereum Protocol Specification, Version 1.14.
[34] Groth, J. (2016). On the Size of Pairing-Based Non-Interactive Arguments. In Advances in Cryptology – EUROCRYPT 2016, pp. 305-326. Berlin: Springer.
[35] Bowe, S., Gabizon, A., & Miers, I. (2017). Scalable Multi-party Computation for zk-SNARKs. Cryptology ePrint Archive, Report 2017/1050.
[36] Bonneau, J., Miller, A., Clark, J., Narayanan, A., Kroll, J. A., & Felten, E. W. (2015). Research Perspectives on Governance of Blockchain-Based Systems. Proceedings of the Workshop on Bitcoin Research, San Juan.
[37] Wood, G. (2024). Ethereum: A Secure Decentralized Generalized Transaction Ledger. Ethereum Project Yellow Paper, EIP-1559 Version.
[38] Bünz, B., Bootle, J., Boneh, D., Poelstra, A., Wuille, P., & Maxwell, G. (2018). Bulletproofs: Short Proofs for Confidential Transactions. In IEEE Symposium on Security and Privacy, pp. 315-334.
[39] Carbon Trust. (2023). Steel Sector Decarbonization: Waste Gas Utilization and Carbon Accounting Methodologies. Industry Decarbonization Series, London.
[40] Zcash Foundation. (2023). Circuit Complexity Analysis for Industrial Applications of Zero-Knowledge Proofs. ZKProof Standards Workshop Proceedings, Berkeley CA.
[41] Polygon Labs. (2024). Performance Benchmarking of zkSNARK Proving Systems. Technical Report, Polygon Zero Knowledge Research Division.
[42] Cachin, C., Kursawe, K., Petzold, F., & Shoup, V. (2001). Secure and Efficient Asynchronous Broadcast Protocols. In Advances in Cryptology – CRYPTO 2001, pp. 524-541.
[43] Gennaro, R., Jarecki, S., Krawczyk, H., & Rabin, T. (1999). Secure Distributed Key Generation for Discrete-Log Based Cryptosystems. In Advances in Cryptology – EUROCRYPT 1999, pp. 295-310.
[44] Boldyreva, A. (2003). Threshold Signatures, Multisignatures and Blind Signatures Based on the Gap-Diffie-Hellman-Group Signature Scheme. In Public Key Cryptography – PKC 2003, pp. 31-46.
[45] International Accreditation Forum. (2024). Accreditation of Carbon Verification Bodies: Requirements and Guidelines. IAF Mandatory Document MD 26:2024, Sydney.
[46] International Aluminium Institute. (2023). Global Aluminium Industry: Greenhouse Gas Emissions Intensity Data 2010-2022. IAI Statistics Report, London.
[47] Lawrence Berkeley National Laboratory. (2023). Time-Varying Grid Carbon Intensity: Implications for Industrial Carbon Accounting. Energy Analysis and Environmental Impacts Division Report LBNL-2023-008.
[48] International Renewable Energy Agency. (2024). Renewable Power Generation Costs 2023: Implications for Grid Carbon Intensity Variability. IRENA Report, Abu Dhabi.
[49] Global Cement and Concrete Association. (2023). Getting the Numbers Right: Industry GHG Emissions Reporting Database Methodology. GCCA Sustainability Guidelines Version 3.0.
[50] International Energy Agency. (2023). Demand Response in Emerging Markets: Technical and Economic Analysis. IEA Clean Energy Transitions Programme, Paris.
[51] China Nonferrous Metals Industry Association. (2023). Aluminum Industry Carbon Footprint Benchmarking Study. CNIA Research Report, Beijing.
[52] European Commission. (2024). CBAM Default Values: Calculation Methodology and Application Rules. Climate Action Directorate Technical Guidance Document, Brussels.
[53] Aluminum Association of China. (2024). Industry Response Strategies to EU Carbon Border Measures. AAC Policy Research White Paper, Beijing.
[54] State Grid Corporation of China. (2024). Provincial Grid Operation and Carbon Intensity Analysis. Operational Records, authorized citation.
[55] Aluminum Association of China. (2024). Industry Response Strategies to EU Carbon Border Measures: Quantitative Impact Assessment. AAC Policy Research White Paper, Beijing.
[56] China Energy Storage Alliance. (2023). Time-of-Use Electricity Pricing and Industrial Load Management. CESA Industry Report Series, Beijing.
[57] China Electricity Council. (2023). National Electric Power Industry Statistics 2023. CEC Annual Report, Beijing. Cross-validated against State Grid Corporation dispatch data showing Shandong hourly variation ranges.
[58] Terawatt Times Institute. (2025). Grid Carbon Intensity Ontology (GCIO): Proposed Data Standard for Cross-Border Carbon Accounting. TTI Technical Specification Draft v1.0, Houston TX.
[59] International Electrotechnical Commission. (2022). IEC 61970 Series: Energy Management System Application Program Interface. Common Information Model Standards, Geneva.
[60] ISO Technical Committee 207. (2023). ISO 14067: Greenhouse Gases — Carbon Footprint of Products — Requirements and Guidelines. International Organization for Standardization, Geneva.
[61] European Network of Transmission System Operators for Electricity. (2024). ENTSO-E Transparency Platform: Data Publication Methodology. ENTSO-E Technical Documentation, Brussels.
[62] FfE Research Institute. (2024). Green Grid Compass: Hourly Carbon Intensity Calculation Using Flow Tracing Methods. Research Report, Munich.
[63] G7 Climate Club. (2024). International Climate Cooperation: Sectoral Approaches to Industrial Decarbonization. G7 Environment Ministers' Communiqué, May 2024.
[64] European Environment Agency. (2023). Costs of Environmental Monitoring in Industrial Installations. EEA Technical Report 12/2023, Copenhagen.
[65] German Association of Energy and Water Industries (BDEW). (2024). Continuous Emissions Monitoring: Market Analysis and Cost Benchmarking. BDEW Industry Survey, Berlin.
[66] IEEE Standards Association. (2023). IEEE 1451: Standard for Smart Transducer Interface. Industrial Instrumentation Standards Series.
[67] Asian Development Bank. (2024). Financing Low-Cost Environmental Monitoring in Developing Asia. ADB Technical Assistance Report, Manila.
[68] International Finance Corporation. (2023). Climate-Smart Industrial Investment: Risk Assessment and Financial Structuring. IFC Advisory Services Report, Washington DC.
[69] Vietnam Chamber of Commerce and Industry. (2024). Cement Industry CBAM Readiness Assessment. VCCI Sector Report, Hanoi.
[70] European Commission. (2024). CBAM Certificate Pricing Mechanism: Technical Specifications. EU Climate Policy Implementation Series, Brussels.
[71] PwC Vietnam. (2024). Carbon Border Tax Impact Assessment for Vietnamese Exporters. Industry Advisory Report, Ho Chi Minh City.
[72] China Aluminum Corporation. (2023). Annual Sustainability Report: Carbon Management Strategies. CHALCO Corporate Publications, Beijing.
[73] Boston Consulting Group. (2024). Protecting Intellectual Property in the Age of Carbon Transparency. BCG Climate and Sustainability Practice, Boston MA.
[74] Deloitte. (2023). Competitive Intelligence Risk in ESG Disclosure: Quantitative Assessment Framework. Deloitte Risk Advisory, New York.
[75] KPMG International. (2024). Zero-Knowledge Verification in Carbon Accounting: Business Case Analysis. KPMG Climate Change and Decarbonization Services, Amsterdam.
[76] Baker & McKenzie. (2024). Cross-Border Data Transfers and Climate Reporting: Legal Risk Assessment. International Trade and Data Privacy Practice, Chicago.
[77] United Nations Industrial Development Organization. (2023). Inclusive Industrial Decarbonization: Technology Access and Capacity Building. UNIDO Green Industry Platform, Vienna.
[78] International Trade Centre. (2024). SME Climate Adaptation Strategies: CBAM Compliance Pathways. ITC Sustainable Trade Centre, Geneva.
[79] European Investment Bank. (2023). Green Transition Financing for Industrial SMEs. EIB Climate Action Advisory Services, Luxembourg.
[80] World Economic Forum. (2024). Industrial Internet of Things for Sustainability: Deployment Case Studies. WEF Centre for the Fourth Industrial Revolution, Geneva.
[81] Climate Technology Centre and Network. (2023). Technology Transfer Mechanisms for Industrial Decarbonization. CTCN Knowledge Resources, Copenhagen.
[82] International Laboratory Accreditation Cooperation. (2024). Accreditation of Novel Environmental Monitoring Technologies. ILAC Guidance Document G29:2024, Sydney.
[83] International Electrotechnical Commission. (2023). IEC 61508: Functional Safety of Electrical/Electronic/Programmable Electronic Safety-Related Systems. IEC Standards, Geneva.
[84] European Co-operation for Accreditation. (2024). EA Guidelines on Accreditation of Digital MRV Systems. EA Publication Reference EA-6/03, Frankfurt.
[85] European Union Agency for Cybersecurity. (2023). Blockchain Security Certification Framework. ENISA Report 2023-BCF-01, Athens.
[86] ISO Technical Committee 207 Subcommittee 7. (2024). Draft International Standard: ISO 14064 Part 4 — Digital MRV Requirements. ISO/DIS 14064-4, Geneva.
[87] Carbon Trust. (2024). Beyond Compliance: Strategic Value of Carbon Data Infrastructure. Carbon Management Services Report Series, London.
[88] European Network of Transmission System Operators. (2023). Demand Response and Frequency Regulation: Industrial Participation Framework. ENTSO-E Market Design Report, Brussels.
[89] Verra Registry. (2024). Privacy-Preserving Methodologies for Industrial Energy Efficiency Projects. VCS Methodology Development, Washington DC.
[90] BMW Group. (2024). Supplier CO₂ Performance Requirements: Technical Specifications for Scope 2 Reporting. BMW Sustainability Standards Update, Munich.
[91] Keohane, R. O., & Victor, D. G. (2011). The Regime Complex for Climate Change. Perspectives on Politics, 9(1), 7-23.
[92] Abbott, K. W., & Snidal, D. (2000). Hard and Soft Law in International Governance. International Organization, 54(3), 421-456.
[93] Bodansky, D. (2016). The Paris Climate Change Agreement: A New Hope? American Journal of International Law, 110(2), 288-319.
[94] Green, J. F. (2014). Rethinking Private Authority: Agents and Entrepreneurs in Global Environmental Governance. Princeton: Princeton University Press.
[95] Rogers, E. M. (2003). Diffusion of Innovations, Fifth Edition. New York: Free Press.
[96] Anderson, R. (2020). Security Engineering: A Guide to Building Dependable Distributed Systems, Third Edition. Indianapolis: Wiley. Chapter 26: Secure Systems Development.
[97] International District Energy Association. (2023). Carbon Accounting for Combined Heat and Power Systems: Methodological Guidance. IDEA Technical Standards Committee Report, Westborough MA.
[98] World Resources Institute & World Business Council for Sustainable Development. (2015). GHG Protocol Scope 2 Guidance: An Amendment to the Corporate Standard. WRI/WBCSD Joint Publication, Washington DC.
Authors

Alex is the founder of the Terawatt Times Institute, developing cognitive-structural frameworks for AI, energy transitions, and societal change. His work examines how emerging technologies reshape political behavior and civilizational stability.

U.S. energy strategist focused on the intersection of clean power, AI grid forecasting, and market economics. Ethan K. Marlow analyzes infrastructure stress points and the race toward 2050 decarbonization scenarios at the Terawatt Times Institute.

Maya is a communications strategist bridging technical modeling and public policy. She synthesizes research on grid modernization and decarbonization, ensuring data-driven insights reach legislators and industry stakeholders.