National Carbon Accounting Structural Difficulty and Enterprise CBAM Compliance: A Cross-National Framework Study

Abstract
The European Union's Carbon Border Adjustment Mechanism (CBAM) fundamentally transforms carbon accounting from voluntary corporate practice into mandatory border compliance. This study develops an analytical framework examining how national-level institutional barriers (Φ) interact with product-level technical complexity (Ψ) to determine enterprise reliance on CBAM default values (τ). Through systematic assessment of seven countries and five industrial sectors, we demonstrate that accounting difficulty varies substantially across industries within single jurisdictions. Germany's power sector exhibits Φ approaching 0.03 through decades of EU ETS implementation, while Vietnam faces Φ of 0.33 despite mandatory reporting frameworks, constrained by verification scarcity and translation barriers. Enterprise analysis across 15 steel and aluminum producers reveals that national structural difficulty amplifies product complexity burdens: Chinese steel firms exhibit τ values of 5-25% despite substantial platform investment, while German counterparts maintain τ below 1% through seamless institutional alignment. CBAM operates not merely as carbon pricing instrument but as institutional filter privileging jurisdictions with low structural accounting difficulty. The study contributes a theoretically-grounded Φ-Ψ-τ framework operationalizing institutional difficulty measurement and provides evidence for amplification dynamics whereby high national barriers magnify burdens of complex product accounting.
1. Introduction
When the EU's CBAM transitional phase commenced in October 2023, global exporters confronted a new reality: carbon data quality had become a trade barrier. The regulation mandates that importers report embedded emissions for covered goods, with the option to use actual facility-specific data or face potentially punitive default values [1].
This choice appears straightforward. Yet it conceals profound institutional complexities. Generating CBAM-compliant actual data requires navigating intricate measurement standards, verification protocols, and methodological translations between domestic frameworks and EU requirements [2].
This article forms part of a research series examining carbon accounting institutional infrastructure under the European Union's Carbon Border Adjustment Mechanism. The series comprises foundational theoretical frameworks establishing core concepts and multiple applied studies investigating specific country-sector contexts, methodological translation protocols, and enterprise response strategies. This inaugural paper develops the Φ-Ψ-τ analytical framework and demonstrates its application through illustrative cases across diverse institutional settings.
Existing literature on carbon border adjustments focuses extensively on economic impacts, trade flow disruptions, and competitiveness concerns [3,4]. Scholars have modeled sectoral exposure, estimated cost pass-through rates, and debated compatibility with WTO rules [5]. What receives less attention is the institutional infrastructure determining which firms can produce compliant data versus those forced into default value dependency.
CBAM's design explicitly penalizes data incapacity through conservative default values. The mechanism operates as both carbon price equalizer and sorting device—dividing exporters into data-capable and data-deficient categories.
We address this gap through two-level investigation. First, we construct a structural difficulty index (Φ) measuring institutional barriers to carbon accounting compliance across five dimensions: standard maturity gaps, monitoring infrastructure deficits, verification body scarcity, digitalization lags, and methodological translation barriers. Applied to strategic country-industry pairs spanning China, Turkey, India, Vietnam, Germany, Brazil, and Indonesia, this framework reveals heterogeneity obscured by nation-level analyses.
Second, we examine enterprise default value dependence (τ) for 15 steel and aluminum producers. This quantifies the proportion of products relying on CBAM default values rather than facility-specific measurements.
Our theoretical contribution centers on demonstrating an interaction effect between national structural difficulty (Φ) and product technical complexity (Ψ). Countries facing high institutional barriers experience disproportionate challenges when products require detailed life cycle assessment. High-Φ nations confronting high-Ψ products experience multiplicative burdens rather than simple addition of difficulties.
Empirically, this manifests in Chinese steel firms exhibiting τ values of 5-25% despite considerable internal capabilities, constrained by translation frictions between GB/T standards and CBAM methodologies. German producers operate in environments where domestic monitoring and reporting regulations already align with CBAM requirements, enabling τ near zero.
This framework enables targeted capacity-building interventions addressing binding constraints rather than generic technology transfer. More fundamentally, it reveals CBAM as institutional architecture that embeds European regulatory preferences into global trade conditions, privileging jurisdictions whose historical development trajectories aligned carbon accounting with ISO/EU standards.
The findings challenge assumptions of uniform national readiness. Even within developing countries, substantial sectoral variation exists.
The analysis proceeds as follows. Section 2 develops the theoretical framework linking institutional barriers to compliance costs through the Φ-Ψ-τ architecture. Section 3 details measurement protocols and case selection logic. Section 4 presents empirical findings for both national difficulty patterns and firm-level dependence. Section 5 discusses implications and offers policy recommendations. Section 6 concludes.
2. Theoretical Framework: From Institutional Barriers to Enterprise Compliance Costs
2.1 Conceptual Foundation: The Φ-Ψ-τ Architecture
This study develops a three-concept framework linking national institutional conditions to enterprise compliance outcomes. We anchor our analysis in the structural difficulty principle established in TTI's 3T Progress Index framework, where Φ (Phi) denotes barriers to system transformation.
In the context of carbon accounting for trade compliance, structural difficulty operates at two distinct levels requiring separate conceptualization.
National Structural Difficulty (Φ): The cumulative institutional barriers within a jurisdiction preventing enterprises from generating internationally recognized emission data. Φ ranges from 0 (minimal barriers) to 1 (severe constraints). Higher values indicate environments where even capable firms struggle to achieve CBAM compliance at reasonable cost. This concept captures how national policy frameworks, infrastructure investments, and regulatory traditions create or remove frictions for carbon data production.
Product Technical Complexity (Ψ): The inherent measurement challenges associated with specific product categories, independent of institutional context. Certain products exhibit straightforward emission profiles amenable to direct monitoring. Others involve intricate allocation across co-products, opaque supply chains, or novel technologies lacking established methodologies. Ψ similarly ranges from 0 (straightforward accounting) to 1 (severe technical challenges).
Enterprise Default Value Dependence (τ): The proportion of a firm's CBAM-covered product portfolio relying on default values rather than actual facility-specific measurements. This outcome variable reflects strategic choices firms make when navigating the combined burden of institutional barriers and technical complexity. τ ranges from 0% (complete actual data coverage) to 100% (full default reliance).
The core theoretical proposition: Φ and Ψ interact rather than simply add.
We formalize this as τ = f(Φ, Ψ, Φ × Ψ), where the functional form f(·) captures how structural difficulty magnifies technical complexity burdens. Countries facing high institutional barriers experience disproportionate difficulty with technically complex products. This relationship distinguishes our framework from additive models implicitly assuming compliance costs scale independently with capacity deficits and product challenges.
2.2 Operationalizing Structural Difficulty (Φ)
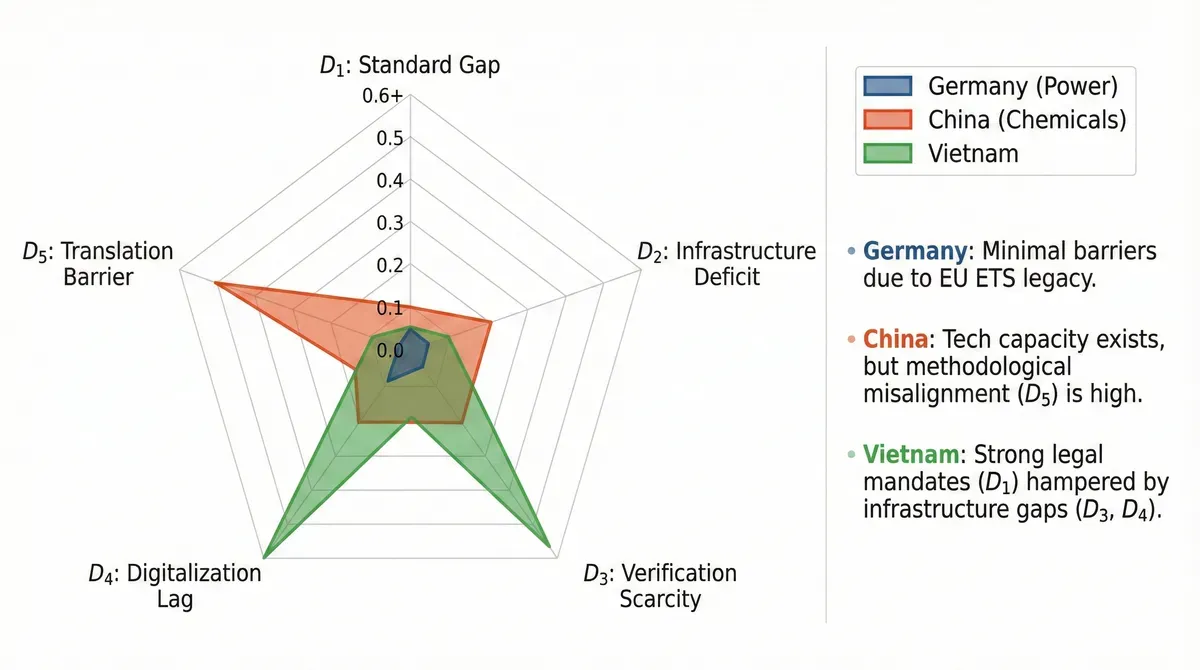
National structural difficulty emerges from five constitutive dimensions, each representing specific institutional deficits impeding carbon accounting. All D_k dimensions are defined as deficit measures. Higher values indicate greater barriers rather than stronger capacity. This directional consistency proves essential for coherent interpretation across jurisdictions.
Standard Maturity Gap (D1): The absence or inadequacy of domestic carbon accounting mandates. Jurisdictions lacking legally binding sector-specific standards impose greater burden on firms who must independently determine appropriate methodologies and boundaries.
We operationalize this dimension by assessing whether countries maintain mandatory frameworks (low D1), voluntary guidelines (moderate D1), or rely solely on generic international protocols without domestic implementation (high D1).
Infrastructure Deficit (D2): The lack of continuous emissions monitoring systems (CEMS) and automated data collection technologies across industrial facilities. Without real-time monitoring infrastructure, firms must rely on periodic manual measurements or engineering estimates that CBAM verifiers may question.
This dimension captures the proportion of facilities lacking monitoring equipment. High CEMS coverage translates to low infrastructure deficit scores.
Verification Scarcity (D3): The unavailability of accredited third-party auditors capable of validating emission reports according to international standards. We measure this through the inverse of IAF-recognized verification body density relative to industrial base size.
Audit market monopolies or complete absence of qualified verifiers receive high scores. Competitive markets with specialized expertise score low. We recognize that verifier count serves as coarse proxy, as auditor scale and sectoral specialization matter beyond simple headcounts. However, IAF accreditation itself imposes minimum competence thresholds, and competitive markets generally reduce bottleneck risks compared to monopolistic structures.
Digitalization Lag (D4): The gap in specialized carbon management software adoption integrating production data with emission calculations. Modern carbon accounting increasingly requires enterprise resource planning systems with embedded carbon modules enabling automated allocation.
This dimension reflects prevalence of spreadsheet-based approaches inadequate for CBAM's granular product-level requirements versus systematic platform deployment.
Translation Barrier (D5): The degree of methodological misalignment between domestic carbon accounting rules and CBAM specifications. Perfect alignment means domestic data directly satisfies CBAM without conversion (low D5). Substantial divergences in system boundaries, allocation procedures, or emission factor derivation require extensive re-calculation (high D5).
This dimension quantifies the methodological friction firms face when translating between regulatory frameworks.
The composite structural difficulty index:
Φ = (D1 + D2 + D3 + D4 + D5) / 5
This simple averaging reflects our assessment that all five dimensions constitute necessary conditions. Excellence in monitoring infrastructure cannot fully compensate for verification body scarcity. Strong standards cannot overcome translation barriers.
Reported Φ ranges in our empirical analysis reflect three sources of uncertainty: expert scoring variance during peer review consensus processes (contributing ±0.03-0.05 variation), temporal dynamics as regulatory frameworks evolve between 2023-2024 (±0.02-0.04), and intra-industry heterogeneity where large versus small enterprises exhibit differential capabilities (±0.03-0.05). The composite ranges (typically ±0.05-0.08 around midpoints) represent estimation uncertainty rather than measured empirical variance.
We report ranges to honestly convey assessment confidence levels rather than false precision. Values approaching zero should be interpreted as asymptotic lower bounds rather than literal absence of friction.
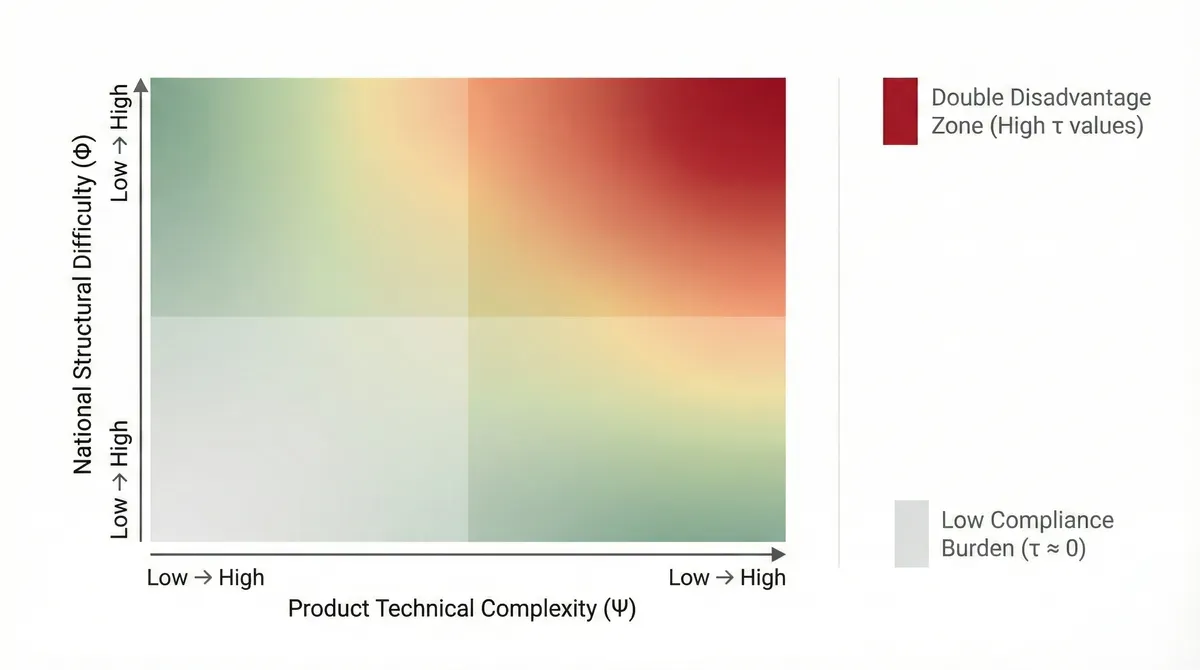
2.3 Product Technical Complexity (Ψ) and the Double Disadvantage Mechanism
Product technical complexity introduces a second dimension of difficulty independent of institutional context. In this study, Ψ primarily reflects allocation and boundary-setting complexity rather than upstream supply chain opacity.
Simple products like primary aluminum ingots involve straightforward process emissions and electricity consumption amenable to direct measurement and standard allocation rules. Complex products such as specialty chemical intermediates require detailed tracking across multiple production stages and careful boundary-setting for co-products with joint production processes.
In this framework-building study, we treat Ψ as qualitative moderator rather than quantified index. Products are classified as low/medium/high complexity based on LCA requirement patterns. Primary commodities (aluminum ingots, crude steel) represent low Ψ. Intermediate manufactures with moderate co-product issues represent medium Ψ. Specialty products with extensive allocation challenges represent high Ψ.
Future research should develop systematic Ψ scoring protocols. The current qualitative approach suffices to demonstrate interaction effects while leaving refinement to subsequent studies.
Our central hypothesis: Φ and Ψ interact multiplicatively. Consider the following conceptual matrix:
| Low Ψ Products | High Ψ Products | |
|---|---|---|
| Low Φ Countries | Minimal burden | Moderate burden |
| High Φ Countries | Moderate burden | Severe burden |
The lower-right cell represents the "double disadvantage zone" where compliance burdens escalate beyond simple addition. High-Φ jurisdictions attempting high-Ψ accounting face multiplicative burden.
Each translation gap compounds. Every verification bottleneck magnifies. All digitalization deficits multiply when applied to intricate life cycle assessment requirements.
We expect this empirically through patterns where high-Φ jurisdictions show steeper increases in τ as Ψ rises compared to low-Φ contexts.
What strikes us as consequential: this mechanism redistributes competitiveness within sectors. Firms producing identical goods with similar carbon intensity may face radically different compliance costs solely due to institutional context. Carbon-efficient producers in high-Φ jurisdictions cannot document their advantage. Less efficient producers in low-Φ contexts easily demonstrate superior performance through actual data submission.
This creates perverse incentives incompatible with CBAM's stated climate objectives.
2.4 Enterprise Default Value Dependence (τ)
While Φ and Ψ establish structural conditions, individual enterprises make strategic choices about carbon data management investment. We capture outcomes through τ:
τ = (Products using CBAM default values / Total CBAM-covered products) × 100%
A firm achieving τ near zero has complete actual data coverage for its export portfolio. Most enterprises occupy intermediate zones, selectively investing in actual data for high-value or high-volume products while accepting defaults for marginal items.
The economic logic driving τ involves comparing compliance costs against potential savings from actual data. CBAM default values incorporate risk premiums to incentivize actual reporting. For a steel exporter shipping 100,000 tons annually, default value markup could impose significant excess costs.
Whether generating actual data proves economically rational depends critically on institutional infrastructure (low Φ) enabling data generation at manageable cost.
In low-Φ jurisdictions like Germany, where monitoring systems, verification bodies, and aligned methodologies already exist, incremental CBAM compliance costs remain modest. But in high-Φ contexts, the same firm faces infrastructure buildup, auditor training, and methodological translation burdens. This substantially alters the cost-benefit calculus.
A critical dynamic emerges: early movers in high-Φ contexts who invest in platforms gain sustained advantages. Laggards face escalating catch-up costs as verification markets saturate and consultants prioritize higher-paying clients. Path dependence sets in rapidly.
3. Methodology and Data
3.1 Case Selection Logic
We employ purposive sampling to maximize variation across both national difficulty levels and industrial sectors. Our selection captures country-industry combinations that span the theoretical space while covering major CBAM-exposed trade flows.
China appears twice—for aluminum and chemicals—reflecting its dominant position in global heavy industry exports and allowing within-country comparison. Turkey similarly receives dual representation due to its unique position as EU customs union member with partial regulatory harmonization yet distinct domestic institutions.
India, Vietnam, Brazil, and Indonesia represent emerging economies at different stages of carbon market development [6,7,8]. Germany serves as the low-Φ benchmark. Indonesia contributes both steel and power sectors, enabling examination of how within-country difficulty varies across industries of differing regulatory priority.
3.2 Structural Difficulty (Φ) Assessment Protocol
Data collection proceeded through systematic extraction from authoritative sources, following three-step verification protocols.
First, we identified official regulatory texts establishing carbon accounting requirements. This included national laws, ministerial regulations, and industry-specific technical standards. For D1 scoring, only legally binding mandates qualified for minimum values (indicating low gaps). China's GB/T 44905-2024 standard for aluminum carbon footprinting meets the sector-specific mandatory criterion [9]. Reliance on generic ISO 14064 suggests higher gap values.
Second, we compiled infrastructure statistics from national environmental agencies, industry associations, and academic publications. CEMS deployment rates for D2 came primarily from official monitoring reports, supplemented by industry surveys where government data proved unavailable. High CEMS coverage translates to low infrastructure deficit scores.
Third, verification body capacity (D3) relied on accreditation agency registries. We searched IAF member databases for each country, filtering by technical scope codes corresponding to greenhouse gas validation and verification (ISO 14065) [10]. Higher verifier density (after normalization) yields lower scarcity scores.
Digitalization assessment (D4) posed greater measurement challenges due to limited public data on enterprise software adoption. We combined industry association surveys reporting carbon management system usage rates, corporate sustainability reports mentioning specific platforms, and market research databases tracking carbon accounting software penetration.
Translation barrier (D5) required detailed methodological comparison between domestic standards and CBAM requirements [2]. We analyzed system boundary definitions, emission factor derivation rules, allocation procedures for co-products, and treatment of indirect emissions across frameworks.
All scores underwent peer review by two independent researchers familiar with respective jurisdictions' carbon policy landscapes. Discrepancies exceeding 0.15 triggered discussion and re-evaluation.
Data Sources and Study Limitations
This framework-building study synthesizes data from multiple sources to construct Φ assessments. For country-level difficulty evaluation, we draw on regulatory frameworks from official government gazettes and legislative databases, infrastructure statistics from national environmental agencies and industry associations, verification capacity from accreditation body registries (IAF members, TURKAK, CNAS), digitalization metrics from industry surveys and corporate reports, and methodological alignment analysis comparing domestic standards with CBAM requirements.
The country-industry cases serve to illustrate the framework's applicability across diverse institutional settings. Geographic coverage remains limited. Sample sizes preclude definitive statistical inference, though preliminary patterns warrant further investigation with larger datasets.
3.3 Enterprise Default Value Dependence (τ) Measurement
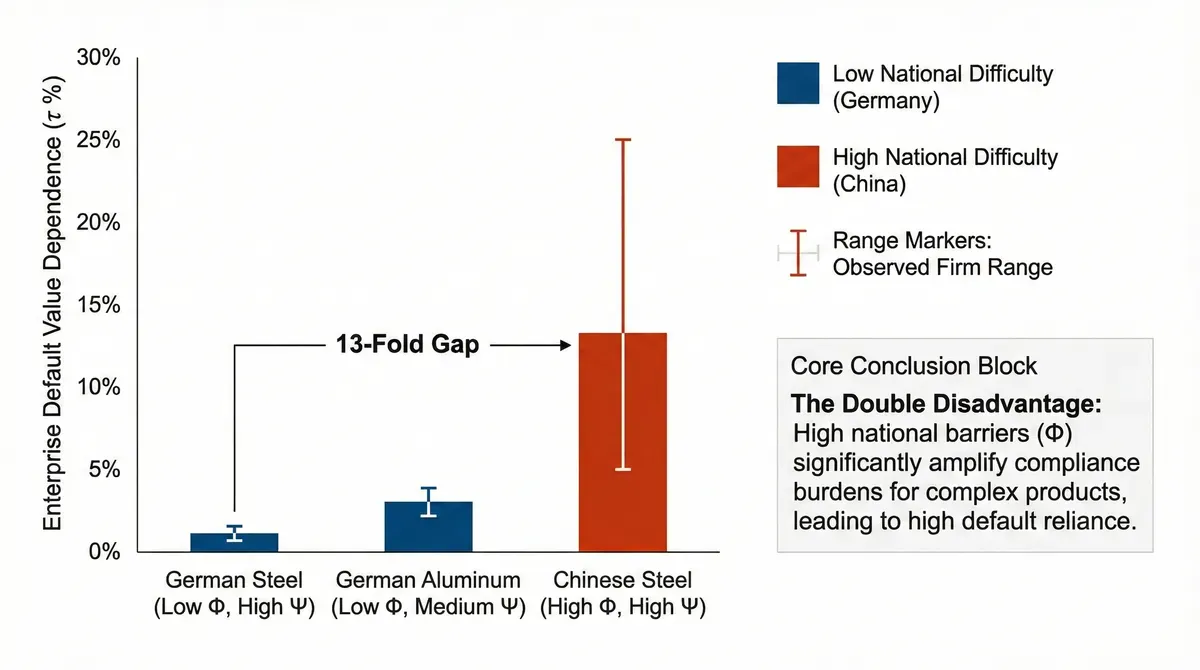
For enterprise-level analysis, we selected 15 leading steel and aluminum producers stratified across three Φ×Ψ cells: China steel (high Φ, high Ψ), Germany steel (low Φ, high Ψ), and Germany aluminum (low Φ, medium Ψ).
This design tests the interaction hypothesis by varying national difficulty while holding product complexity constant and varying complexity while holding difficulty constant.
τ measurement proceeded through systematic extraction from corporate sustainability reports, industry communications, and CBAM-related public disclosures. Where companies did not directly report τ, we inferred values through disclosed environmental product declaration coverage, reasoning that products with verified EPDs would utilize actual data for CBAM rather than defaults.
We acknowledge that EPD coverage serves as upper-bound proxy for CBAM actual data eligibility. Three systematic biases may affect our estimates.
First, EPD system boundaries may not perfectly align with CBAM's specific requirements, particularly for indirect emissions and co-product allocation. This suggests our τ estimates may understate actual default value reliance by 2-5 percentage points.
Second, firms may possess CBAM-compliant data without publishing EPDs, particularly in non-European markets where EPD adoption lags.
Third, disclosure bias means leading firms preferentially report data management capabilities, potentially underrepresenting industry-wide default value dependence.
We treat these biases as partially offsetting in expectation, positioning our estimates as reasonable central tendencies rather than definitive measurements.
3.4 Analytical Approach
We employ primarily descriptive and comparative analytics, befitting an exploratory study aimed at revealing patterns. The core analysis presents Φ assessments in table formats, enabling rapid comparison across dimensions and jurisdictions. For τ analysis, we present distributions within each Φ×Ψ cell with overlay of individual firm values.
4. Empirical Findings
4.1 National Structural Difficulty: The Φ Landscape
Table 1 presents structural difficulty assessments. The variation is substantial—both across countries and within national jurisdictions.
Germany's power sector displays Φ approaching 0.03, representing near-minimal barriers through decades of EU ETS implementation creating comprehensive carbon accounting ecosystems where monitoring, reporting, and verification operate as routine business functions [2].
Table 1: Structural Difficulty (Φ) Assessment Across Country-Industry Pairs
| Country | Industry | D1: Standard Gap | D2: Infrastructure Deficit | D3: Verification Scarcity | D4: Digitalization Lag | D5: Translation Barrier | Overall Φ |
|---|---|---|---|---|---|---|---|
| Germany | Power | 0.05 | 0.02 | 0.02 | 0.05 | 0.02 | 0.03 |
| China | Aluminum | 0.10 | 0.10 | 0.10 | 0.25 | 0.15 | 0.14 |
| China | Chemicals | 0.20 | 0.10 | 0.10 | 0.35 | 0.40 | 0.23 |
| Turkey | Chemicals | 0.10 | 0.25 | 0.10 | 0.40 | 0.10 | 0.19 |
| Turkey | Aluminum | 0.10 | 0.25 | 0.10 | 0.40 | 0.10 | 0.19 |
| India | Power | 0.20 | 0.25 | 0.10 | 0.40 | 0.35 | 0.26 |
| Vietnam | Power | 0.10 | 0.25 | 0.45 | 0.60 | 0.25 | 0.33 |
| Brazil | Power | 0.10 | 0.25 | 0.30 | 0.40 | 0.25 | 0.26 |
| Indonesia | Power | 0.10 | 0.10 | 0.30 | 0.40 | 0.25 | 0.23 |
| Indonesia | Steel | 0.20 | 0.25 | 0.30 | 0.60 | 0.40 | 0.35 |
Note: All dimensions (D1-D5) scored from 0 (minimal barriers) to 1 (severe barriers). Overall Φ represents simple arithmetic mean.
Chinese cases illustrate meaningful industry heterogeneity within single jurisdictions. The aluminum sector achieves Φ of 0.14, driven by mandatory GB/T 44905-2024 standard implementation (low D1) [9], extensive CEMS deployment (low D2), and mature verification markets (low D3).
Chemicals score notably higher at Φ = 0.23 despite comparable infrastructure. The 0.09 absolute gap represents a 64% increase in structural difficulty (0.23/0.14 = 1.64), equaling differences observed between distinct national contexts.
This reflects weaker sector-specific standards (higher D1) and substantially higher translation barriers (D5 = 0.40) as industry-standard PCF methodologies diverge from CBAM's allocation rules for petrochemical co-products. The within-China gap challenges assumptions of uniform national difficulty.
Turkey emerges as methodological alignment success despite digitalization constraints. Both chemical and aluminum sectors achieve moderate Φ scores around 0.19, with strong translation capability (low D5 = 0.10) due to the country's MRV regulation mirroring EU ETS structure [10].
This partial offset suggests that policy design emphasizing international alignment can substitute for technological capacity regarding CBAM compliance costs.
Vietnam and India present contrasting profiles despite similar overall Φ scores. Vietnam achieves low standard maturity gap (D1 = 0.10) through Decree 06/2022's mandatory reporting obligations [7] but suffers from severe verification scarcity (D3 = 0.45) and extreme digitalization lag (D4 = 0.60).
India inverts this pattern. Low verification scarcity (D3 = 0.10) thanks to extensive accreditation systems. Yet higher standard gaps (D1 = 0.20) as its Carbon Credit Trading Scheme remains under implementation [6].
Both routes arrive at similar composite difficulty around Φ = 0.26-0.33. The underlying mechanisms differ profoundly. This compositional variation matters for policy intervention design—Vietnam requires verification body development whereas India needs strengthening legal mandates.
Indonesia's dual sectors demonstrate how regulatory prioritization creates difficulty gradients within countries. Power achieves lower Φ = 0.23 following 2023 ETS implementation [8], which drove CEMS installations and verification market growth. Steel scores higher at Φ = 0.35, remaining under voluntary Green Industry Standard with substantially higher infrastructure deficits and digitalization lags.
Dimension-specific patterns yield insights. Standard maturity gaps show limited variation, with most cases scoring between 0.10-0.20, reflecting widespread adoption of mandatory reporting frameworks in recent years.
Digitalization exhibits greatest spread, ranging from 0.05 to 0.60. Translation barriers sharply divide EU-aligned systems from others.
4.2 Enterprise Default Value Dependence: Divergent τ Patterns
Analysis across three Φ×Ψ cells reveals patterns consistent with the interaction hypothesis.
German steel producers cluster near zero τ. Four of five firms below 1%. Only ArcelorMittal reaches approximately 2% due to complex global supply chain feedstock tracking.
Chinese steel presents striking within-cell heterogeneity despite uniform national institutional context. Baowu achieves τ in the 5-8% range, approaching German levels through intensive digital platform investment. HBIS follows at approximately 10-12%, leveraging its Serbian subsidiary's direct EU ETS exposure to accelerate group-wide data management improvements.
At the cell's upper bound, Jianlong reaches approximately 20-25%. This reflects challenges of integrating carbon data across geographically dispersed asset bases assembled through acquisitions.
This substantial τ range within identical national-institutional contexts directly evidences the mediating role of firm-level strategic choices. Chinese leaders invest heavily in carbon platforms despite domestic regulations not yet mandating product-level accounting. CBAM's looming default value penalties serve as forcing mechanism.
German aluminum yields intermediate τ values between steel patterns and Chinese cases. All remain below 5%. The slight elevation reflects greater supply chain complexity for aluminum, particularly tracing bauxite and alumina origins where developing-country mining operations may lack robust data.
Comparing German steel (low Φ, high Ψ) versus Chinese steel (higher Φ, high Ψ) tests the interaction hypothesis directly. German mean τ approximates 1%. Chinese mean approximates 13%.
A thirteen-fold difference.
This gap substantially exceeds the difference between German steel and German aluminum, where product complexity varies but national difficulty remains constant.
Baowu's relatively low τ, substantially below the Chinese cell average, prompted investigation into distinctive firm characteristics. Beyond platform investment, Baowu has uniquely pursued international technology partnerships—collaboration with BHP on direct reduced iron trials, joint ventures with ArcelorMittal.
These relationships provide exposure to European carbon accounting norms and verification practices, effectively importing low-Φ institutional knowledge into higher-Φ contexts. We term this "firm-level institutional arbitrage."
4.3 Robustness Considerations
Given measurement uncertainties, we conducted systematic sensitivity analyses. For Φ assessments, allowing component scores to vary within reasonable bounds yields ranges of approximately ±0.05-0.08 around point estimates. Country rankings remain stable across this range.
For τ values, testing sensitivity to reasonable reassignments shows cell separation narrows under maximum adjustment scenarios but persists. An alternative operationalization treats τ as emission-weighted rather than product-weighted. Analysis of available product-level emission data shows high correlation between measures. This suggests firms making strategic choices about actual data investment generally prioritize high-carbon-intensity products.
5. Discussion
5.1 Theoretical Contributions
This study makes three theoretical contributions that fundamentally reframe carbon border adjustment analysis.
First, we demonstrate that CBAM functions not merely as carbon pricing instrument but as institutional filter privileging jurisdictions with low structural accounting difficulty. By operationalizing what prior literature treated as unobserved heterogeneity through the five-dimensional Φ framework, we reveal that "compliance costs" fundamentally reflect structural difficulty in translating domestic carbon accounting practices into internationally recognized formats.
Whereas prior literature models CBAM effects on trade flows assuming compliance cost distributions [3,4], we endogenize those costs through systematic difficulty measurement.
Second, we demonstrate multiplicative rather than additive interactions between national structural difficulty (Φ) and product technical complexity (Ψ). Standard analyses implicitly assume compliance difficulty scales independently with capacity deficits and product challenges.
Our evidence suggests amplification dynamics instead. Countries already disadvantaged in absolute terms experience disproportionate burdens for complex goods, potentially excluding them from product segments requiring sophisticated carbon accounting regardless of manufacturing efficiency.
Third, we establish carbon accounting capacity as emerging dimension of 21st-century trade power. The firm-level institutional arbitrage mechanism identified through outlier analysis reveals how leading enterprises in high-Φ jurisdictions can substantially improve τ through strategic investment. This creates within-country winners and losers based on capital access and management sophistication.
The resulting market concentration pressure may harm smaller exporters unable to afford carbon management platforms—even if they produce low-emission goods.
A point often overlooked: our findings engage debates about CBAM's compatibility with climate justice principles [5]. The translation barrier dimension (D5) quantifies how methodological misalignment imposes costs even when underlying data infrastructure exists. China's chemical sector exemplifies this—strong monitoring and verification capacity nonetheless yields moderate overall difficulty due to allocation rule divergences.
5.2 Policy Implications
The documented heterogeneity across Φ dimensions suggests targeted capacity-building interventions.
For Vietnam and similar contexts scoring high on verification scarcity (D3), supporting accreditation infrastructure development could yield high returns. Development finance institutions might fund expansion of national accreditation systems, training programs for domestic auditors, and mutual recognition agreements with IAF.
Conversely, jurisdictions like Turkey scoring low on translation barriers (D5) but higher on digitalization lags (D4) require different support emphases. Rather than verification body development, Turkey benefits from digitalization incentives: subsidies for carbon management software adoption, public provision of data integration platforms, or tax credits for emission monitoring upgrades.
China's situation invites more nuanced intervention. Low scores across most dimensions suggest technical capacity exists, with translation gaps representing primary constraints. Potential solutions operate at both domestic and EU negotiation levels.
Domestically, China could align forthcoming carbon accounting standards more closely with CBAM methodologies. Alternatively, EU-China negotiations might establish mutual recognition procedures accepting Chinese standards with defined conversion factors.
For enterprise strategy, findings underscore business cases for proactive carbon data investment anticipating CBAM and similar mechanisms. Leading firms' platform investments position companies to avoid default value penalties. Smaller firms unable to afford proprietary platforms might pursue collective solutions through industry associations.
The interaction effect suggests particularly urgent intervention for high-Φ countries producing high-Ψ goods. Transition support programs should prioritize these sectors, potentially including temporary default value adjustments recognizing that institutional capacity building requires time.
5.3 Limitations and Future Research
The country-industry sample cannot claim statistical representativeness of global diversity. Small island developing states, least developed countries, and several major regions remain underrepresented.
The Φ framework's five-dimension structure reflects conceptual judgment rather than empirical validation. Alternative dimensionality reduction approaches might reveal different underlying structures. Larger-scale data collection would permit testing whether dimensions prove orthogonal or cluster into fewer latent factors.
The equal-weighting scheme requires empirical validation. Alternative aggregation methods—such as geometric mean to capture bottleneck effects or data-driven weighting through larger-scale analysis—may better reflect how dimensions interact in determining actual compliance costs.
Enterprise τ measurement relies on inference from partial disclosures given limited mandatory reporting on CBAM preparedness. As regulations take effect and reporting requirements expand, more systematic firm-level data will enable refined analysis.
The interaction hypothesis requires testing with larger samples and statistical controls. Our dataset permits identifying patterns but not precisely estimating marginal effects. Future research combining comprehensive firm-level τ measurements with detailed difficulty metrics across hundreds of enterprises would strengthen causal inference.
Falsifiable Predictions
Our framework generates testable predictions that future research can validate or refute:
First, if Turkey invests heavily in digitalization (reducing D4) while maintaining translation advantage, we predict Φ declining to approximately 0.10 by 2027. Observing Φ exceeding 0.15 would challenge our weighting scheme and suggest digitalization matters less than our framework assumes.
Second, if Chinese steel firms' τ converges to German levels (below 2%) within two years despite unchanged national Φ, this would falsify the structural difficulty hypothesis. Such convergence would indicate firm-level factors dominate national institutional barriers.
Third, if high-Ψ products (chemicals) show lower τ variance across countries than low-Ψ products (aluminum), the interaction mechanism requires reformulation. Our theory predicts variance should amplify with product complexity.
Finally, this study treats Φ and τ as essentially static, measured at points in time. Yet capacity building proceeds dynamically, with investments determining future capabilities. Longitudinal analysis tracking how countries and firms evolve through CBAM transition phases would reveal adjustment pathways.
6. Conclusion
Carbon border adjustments represent transformation in trade governance, embedding technical capacity requirements into market access conditions.
This study demonstrates that preparedness for CBAM compliance varies profoundly—both across nations and within national industrial landscapes. Five institutional dimensions shape this variation: legal mandates, physical infrastructure, verification capacity, digitalization, and methodological alignment.
Germany displays Φ approaching 0.03 through decades of EU ETS implementation creating comprehensive carbon accounting ecosystems. Vietnam faces Φ of 0.33 despite strong legal frameworks [7].
The interaction between national structural difficulty (Φ) and product technical complexity (Ψ) generates multiplicative burdens. This imposes double disadvantage on high-difficulty countries attempting sophisticated product accounting. Chinese steel producers, despite substantial firm-level platform investment, maintain default value dependence of 5-25% due to translation frictions between domestic standards and CBAM methodologies.
German counterparts, operating in perfectly aligned institutional environments, achieve essentially zero dependence.
Within-country heterogeneity proves substantial. China's aluminum sector achieves notably lower Φ (0.14) than chemicals (0.23) within the same jurisdiction. Sector-specific standard maturity and methodological translation differences drive this gap.
Such variation suggests that trade negotiations over CBAM transition support should recognize sectoral stratification, directing assistance toward industries facing greatest disadvantages regardless of national averages.
Capacity building interventions achieve greatest impact when tailored to binding constraints. Verification body development for Vietnam. Digitalization subsidies for Turkey. Methodological alignment negotiations for China.
Generic technology transfer programs ignoring these diagnostic distinctions risk wasting resources on non-binding constraints while leaving critical bottlenecks unaddressed.
For enterprise strategy, business cases for proactive carbon data investment grow increasingly compelling. As CBAM default values incorporate expanding penalties, firms maintaining high default dependence face current cost disadvantages and risk permanent competitiveness erosion.
Leading enterprises demonstrate that strategic investment can partially overcome national institutional deficits, achieving performance approaching low-difficulty contexts through proprietary platforms and international partnerships.
CBAM's broader trajectory suggests that carbon accounting capacity will increasingly determine trade competitiveness across global markets beyond Europe. The UK's proposed carbon border levy, United States' provisions under debate, and various national schemes under development will expand the scope of products requiring verified carbon data.
Jurisdictions investing early in institutional capacity building position themselves advantageously for this transition. Those delaying face compounding disadvantages as standards diffuse globally.
Future research should expand geographic coverage, extend temporal depth through longitudinal observation, and refine measurement of both difficulty dimensions and enterprise responses. The interaction hypothesis merits testing with larger samples enabling more rigorous identification strategies.
As CBAM implementation proceeds and data availability improves, tracking how the Φ-τ relationship evolves will illuminate whether initial difficulty gaps persist through path dependence or converge through learning and investment. Understanding these dynamics proves essential for designing transition support programs genuinely capable of promoting climate ambition while respecting development imperatives.
References
[1] European Commission. (2023). Regulation (EU) 2023/956 establishing a carbon border adjustment mechanism. Official Journal of the European Union, L 130/52.
[2] European Commission. (2018). Commission Implementing Regulation (EU) 2018/2066 on the monitoring and reporting of greenhouse gas emissions. Official Journal of the European Union, L 334/1.
[3] Böhringer, C., Carbone, J. C., & Rutherford, T. F. (2022). Embodied carbon tariffs. The Scandinavian Journal of Economics, 124(3), 612-643.
[4] Cosbey, A., Droege, S., Fischer, C., & Munnings, C. (2019). Developing guidance for implementing border carbon adjustments: Lessons, cautions, and research needs from the literature. Review of Environmental Economics and Policy, 13(1), 3-22.
[5] Mehling, M. A., van Asselt, H., Das, K., Droege, S., & Verkuijl, C. (2019). Designing border carbon adjustments for enhanced climate action. American Journal of International Law, 113(3), 433-481.
[6] Bureau of Energy Efficiency India. (2024). Carbon Credit Trading Scheme implementation framework. New Delhi: Ministry of Power.
[7] Ministry of Natural Resources and Environment Vietnam. (2022). Decree No. 06/2022/ND-CP on greenhouse gas emission reduction and ozone layer protection. Hanoi: MONRE.
[8] Ministry of Environment and Forestry Indonesia. (2023). Regulation on mandatory continuous emissions monitoring systems. Jakarta: MOEF.
[9] Standardization Administration of China. (2024). GB/T 44905-2024: Carbon footprint quantification method for electrolytic aluminum. Beijing: SAC.
[10] Turkish Accreditation Agency. (2024). Directory of accredited greenhouse gas verification bodies. Ankara: TURKAK.
[11] Brazilian Ministry of Environment. (2024). Regulated Carbon Market Framework (Lei do Mercado Regulado de Carbono). Brasília: Government of Brazil.
[12] World Bank. (2024). State and Trends of Carbon Pricing 2024. Washington, DC: World Bank Group.
Authors

Alex is the founder of the Terawatt Times Institute, developing cognitive-structural frameworks for AI, energy transitions, and societal change. His work examines how emerging technologies reshape political behavior and civilizational stability.

U.S. energy strategist focused on the intersection of clean power, AI grid forecasting, and market economics. Ethan K. Marlow analyzes infrastructure stress points and the race toward 2050 decarbonization scenarios at the Terawatt Times Institute.

Maya is a communications strategist bridging technical modeling and public policy. She synthesizes research on grid modernization and decarbonization, ensuring data-driven insights reach legislators and industry stakeholders.