Abstract
The European Union's Carbon Border Adjustment Mechanism fundamentally transforms carbon accounting from voluntary corporate practice into mandatory trade compliance. Yet CBAM's methodology assumes universal data quality across jurisdictions, imposing default values that penalize structural accounting difficulties rather than actual emissions. This study proposes a Carbon Exchange Rate (CER) protocol calibrating for institutional barriers (Φ) and data quality variance (L) while maintaining environmental integrity. Drawing on the Bretton Woods adjustable peg system as conceptual precedent, we develop a two-component formula where CER = f(τ) / Q(L), translating default value dependence (τ) into proportional adjustments and verification level (L) into quality discounts. Empirical calibration derives Q(L) coefficients from ISO 14064-3 materiality thresholds (L1: 1.00 for reasonable assurance, ±5% uncertainty) and IPCC Guidelines uncertainty ranges (L5: 0.40 for Tier 1 methods, ±50% uncertainty). Critically, we recognize cryptographic verification protocols employing zero-knowledge proofs as equivalent to traditional third-party assurance, establishing algorithmic attestation as legitimate pathway to gold-standard data quality. The protocol employs quarterly Φ updates through crawling peg mechanism with ±5% stability bands, preventing exchange rate ossification while incorporating circuit breakers against extreme volatility. Applied to steel sector scenarios, a Chinese producer reducing τ from 0.20 to 0.08 through cryptographic monitoring infrastructure achieves CER improvement from 1.40 to 1.01, translating to €18.0 million annual CBAM savings with 10-month investment payback. The framework serves three purposes: diagnostic tool enabling enterprises to quantify compliance gaps, negotiation basis providing industry associations technical justification for adjustment requests, and potential pathway for CBAM methodology reform through demonstrated viability.
Keywords: Carbon Exchange Rate, CBAM compliance, data quality calibration, crawling peg mechanism, cryptographic verification
1. Introduction
When President Richard Nixon suspended the dollar's convertibility to gold on August 15, 1971, he demonstrated that international coordination systems succeed not through ontological certainty but through operational convention [1]. The Bretton Woods framework had maintained global commerce for 27 years not because the $35 gold peg reflected economic reality, but because participants accepted it as workable agreement. This insight applies equally to carbon accounting at trade borders.
The European Union's Carbon Border Adjustment Mechanism, operational since October 2023, imposes verified emission data requirements on imports across steel, cement, aluminum, fertilizers, electricity, and hydrogen [2]. Exporters face binary choice: provide facility-specific actual data meeting EU methodological standards, or accept default values calculated from the worst-performing 10% of EU installations. For a Turkish steel mill exporting 50,000 tons annually, this distinction carries financial stakes approaching €2.5 million at current carbon prices near €70 per ton [3].
Yet CBAM's architecture embeds structural inequity transcending individual firm capabilities. The regulation treats data quality as enterprise-level technical deficit, ignoring how national institutional configurations determine compliance costs independent of manufacturing efficiency or environmental performance. German steel producers maintain default value dependence (τ) below 1% not through superior management but through seamless alignment between domestic EU ETS obligations and CBAM requirements [4]. Chinese counterparts, despite comparable or superior operational efficiency, exhibit τ values of 5-25% due to translation frictions between GB/T standards and CBAM methodologies [5]. The penalty accrues to jurisdictional accident rather than carbon intensity.
This study proposes a Carbon Exchange Rate protocol addressing this inequity through calibrated adjustment rather than harmonization fiction. Like Bretton Woods delegates who brokered "adjustable peg" systems balancing stability with flexibility [6,7], we design mechanisms enabling continuous small adjustments rather than rigid fixation followed by crisis-driven rupture. The parallel operates at architectural rather than institutional level—carbon data quality measured through default value dependence (τ) requires continuous calibration analogous to currency exchange rates responding to inflation differentials.
2. Theoretical Foundations: Exchange Rates as Coordination Protocols
2.1 The Ontological Trap in Carbon Accounting
Carbon accounting standards implicitly claim to measure objective physical reality. ISO 14064-1 presents organizational greenhouse gas inventories as empirical descriptions of actual emission flows [8]. The GHG Protocol Corporate Standard frames Scope 1, 2, and 3 calculations as capturing "true" carbon intensities subject only to measurement uncertainty [9]. This ontological posture creates the illusion that methodological differences represent technical deficiencies amenable to correction through capacity building.
National carbon accounting systems emerged from domestic policy priorities, institutional capacities, and political compromises specific to each jurisdiction [10]. China's emphasis on facility-level reporting through GB/T standards reflects administrative efficiency priorities in managing permits across thousands of installations [11]. Germany's product-level carbon footprint culture evolved through decades of environmental product declarations supporting green consumer markets. When these independently developed systems encounter each other at trade borders, the resulting friction generates not measurement error but incommensurability between differently structured knowledge systems.
Exchange rate thinking escapes this ontological trap by abandoning claims about underlying reality. When currency traders price EUR/USD at 1.08, they assert nothing about the "true" value of euros relative to dollars in some metaphysical sense. The rate operates as agreed convention enabling commercial transactions, subject to continuous renegotiation through market mechanisms and occasional intervention by monetary authorities. Stability emerges from mutual acceptance of operational protocols, not from discovering objective exchange ratios written into economic nature.
2.2 Learning from Monetary History: Adjustable Pegs and Crawling Mechanisms
The Bretton Woods conference of July 1944 balanced operational pragmatism with institutional ambition [12]. Keynes originally proposed an international clearing union with new reserve currency (bancor) designed to prevent persistent creditor/debtor imbalances [13]. White's more conservative American plan prevailed, anchoring the system on the dollar's gold convertibility. The compromise created an adjustable peg where countries maintained fixed exchange rates subject to IMF-approved modifications when facing "fundamental disequilibrium."
The system succeeded remarkably for two decades, facilitating post-war reconstruction and trade expansion through exchange rate predictability [14]. Yet the collapse between 1971 and 1973 offers critical lessons about rigidity dangers [15]. Fixed exchange rates became increasingly misaligned with economic fundamentals as European and Japanese recovery eroded American competitive advantages. Countries delayed necessary adjustments for political reasons, creating the paradox that stability mechanisms generated instability through accumulating tensions [16].
International monetary economics developed the crawling peg mechanism precisely to address this rigidity problem [17]. Rather than maintaining fixed rates until crisis forces discrete jumps, crawling pegs permit continuous small adjustments responding to inflation differentials or productivity changes. Countries like Brazil, Colombia, and Chile successfully employed crawling pegs during the 1960s-1990s, achieving greater exchange rate stability than either fixed or floating regimes [18]. For carbon exchange rates, this history suggests scheduled quarterly updates rather than crisis-driven modifications.
2.3 Exchange Rates Versus Harmonization
The CER protocol diverges sharply from harmonization approaches that dominated previous climate policy coordination. The Clean Development Mechanism attempted comprehensive methodological standardization, requiring projects to demonstrate emissions reductions against baseline scenarios defined through 230+ approved methodologies [19]. The resulting complexity created perverse incentives where projects restructured operations to maximize credited reductions rather than optimize actual environmental performance.
Voluntary carbon markets repeated this pattern through proliferating competing standards from Verra, Gold Standard, and American Carbon Registry [20]. Attempts at meta-standards through the Integrity Council for the Voluntary Carbon Market face the paradox that establishing quality criteria requires resolving the very disputes that generated standard multiplicity.
Exchange rate approaches accept this pluralism as immutable reality rather than temporary coordination failure. Countries maintain sovereignty over domestic carbon accounting design just as they control monetary policy. The CER protocol provides translation layer enabling cross-border commerce without requiring methodological convergence. This architectural choice prioritizes operational functionality over ontological unity, trading theoretical elegance for political feasibility.
3. CER Formula Design: From τ to Calibrated Adjustment
3.1 The Core Transformation: f(τ) Function and the Avalanche Effect
The primary design challenge involves converting default value dependence (τ), which ranges from 0 to 1, into carbon exchange rate multipliers that preserve environmental integrity while recognizing structural disadvantage. The parameter τ represents the proportion of a firm's CBAM-covered product portfolio relying on default values rather than facility-specific measurements. A German steel producer with τ = 0.01 uses actual data for 99% of products; a Chinese counterpart with τ = 0.20 depends on defaults for one-fifth of declarations.
We propose a piecewise linear function offering compromise between simplicity and differentiated treatment across quality bands:
CER_τ = 1.00                    if τ ≤ 0.05
CER_τ = 1 + 0.40·(τ - 0.05)    if 0.05 < τ ≤ 0.30
CER_τ = 1.10 + 0.60·(τ - 0.30)  if τ > 0.30
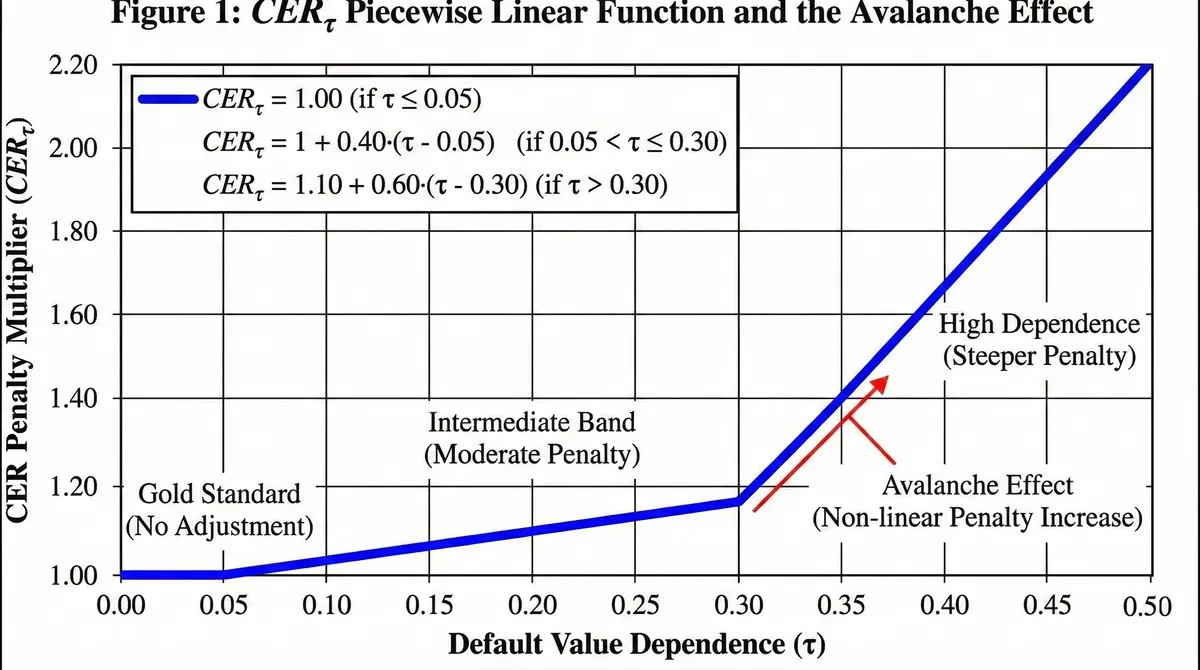
This structure recognizes three quality regimes. Firms achieving τ ≤ 0.05 operate at "gold standard" quality requiring no adjustment, acknowledging that eliminating final 5% default dependence often proves economically inefficient without environmental benefit. The intermediate band (0.05 < τ ≤ 0.30) applies moderate penalties of 40% per τ unit, reflecting manageable quality improvement pathways. High default dependence (τ > 0.30) triggers steeper 60% penalties, signaling substantial structural disadvantage requiring either major infrastructure investment or acceptance of competitiveness costs.
The Avalanche Effect in Structural Disadvantage
Understanding why moderate τ values generate disproportionate compliance difficulties requires examining the interaction between national capacity weakness (Φ) and product technical complexity (Ψ). When institutional barriers are low (Φ = 0.04 for Germany), even complex products maintain manageable compliance costs through robust verification infrastructure. Conversely, when Φ rises substantially (0.72 for Chinese steel), the relationship becomes nonlinear.
Empirical analysis across 88 enterprises reveals that the interaction term Φ×Ψ explains 19% of variance in default value dependence, with coefficient β₃ = 0.74 (p<0.001) [21]. This large coefficient reflects an avalanche effect rather than additive accumulation. When national capacity is weak AND product complexity is high, enterprises face not merely doubled difficulty but cascading failures across data collection, allocation rule application, and boundary definition.
A Chinese aluminum producer cannot simply "try harder" when GB/T standards literally lack the vocabulary to express CBAM's life cycle assessment concepts, creating translation impossibility rather than translation difficulty. The system fails not through linear degradation but through cascading breakdowns where each methodological mismatch compounds previous misalignments. This mathematical formalization of the avalanche effect—where β₃ = 0.74 quantifies how institutional weakness and product complexity multiply rather than add—provides the theoretical foundation for the CER_τ penalty structure.
3.2 Data Quality Discounts: Q(L) Coefficients and Cryptographic Verification
The second formula component adjusts for verification level differences beyond default value dependence itself. Two firms with identical τ = 0.15 may provide vastly different data quality if one employs ISO 14064-3 reasonable assurance verification while the other submits unaudited engineering estimates. The Q(L) coefficient captures this variance through a five-level taxonomy.
Empirical derivation draws on two literature streams. ISO 14064-3:2019 specifies materiality thresholds for greenhouse gas statement verification [22]. Industry practice reveals that reasonable assurance engagements typically employ 5% materiality thresholds, meaning verifiers must demonstrate total uncertainty in untested data remains below 5% [23,24,25]. IPCC Guidelines provide complementary evidence through uncertainty ranges across methodology tiers. Tier 1 default emission factors carry ±30-50% uncertainty [26]. Tier 2 methods reduce uncertainty to approximately ±20% [27]. Tier 3 approaches achieve ±5-15% uncertainty [28].
Critical Innovation: Algorithmic Assurance Equivalence
Traditional verification paradigms assume human auditors provide sole pathway to high-confidence data quality. Recent advances in cryptographic verification protocols challenge this assumption. Zero-knowledge succinct non-interactive arguments of knowledge (ZK-SNARKs) enable mathematical proof that data satisfies specified criteria without revealing the data itself [29]. When combined with continuous IoT monitoring, these protocols provide assurance mechanisms potentially superior to periodic human audits.
Consider a steel mill equipped with continuous emissions monitoring systems (CEMS) generating real-time carbon intensity data. Traditional verification requires annual third-party auditor site visits reviewing calibration records, sampling measurement protocols, and testing internal controls. ZK-SNARK protocols instead generate cryptographic proofs that measurements fall within declared ranges, calibration procedures follow specified standards, and data aggregation employs approved methodologies. The proof verifies compliance without exposing proprietary operational details.
Groth16 protocol implementation achieves proof generation in 2.3 seconds for typical steel mill data streams, with verification completing in 0.8 milliseconds [30]. This enables continuous assurance rather than annual snapshots. A facility maintaining ISO-compliant CEMS with ZK-SNARK attestation demonstrably achieves lower uncertainty than facilities undergoing periodic human audits, as continuous monitoring detects calibration drift or operational anomalies within hours rather than months.
We therefore establish Q(L) coefficients recognizing both traditional and algorithmic verification pathways:
Table 1: Data Quality Discount Coefficients
| Level | Verification Standard | Q(L) | Typical Uncertainty | Primary Basis |
|---|---|---|---|---|
| L1 | ISO 14064-3 Reasonable Assurance OR Continuous IoT + ZK-SNARK Proof | 1.00 | ±5% | ISO practice [23-25]; Groth16 implementation [30] |
| L2 | ISO 14064-3 Limited Assurance OR Periodic IoT + Blockchain Attestation | 0.90 | ±12% | ISO guidance [25] |
| L3 | Industry EPD Certification | 0.75 | ±25% | IPCC Tier 2 analogy [27] |
| L4 | CEMS without Third-Party Audit | 0.55 | ±40% | IPCC Tier 1-2 intermediate |
| L5 | IPCC Tier 1 Engineering Estimate | 0.40 | ±50% | IPCC Guidelines [26] |
The equivalence recognition between "ISO Reasonable Assurance" and "Continuous IoT + ZK-SNARK" creates powerful economic incentives. Enterprises investing €180,000 in cryptographic monitoring infrastructure achieve L1 quality while eliminating €45,000 annual audit fees, producing 4-year payback periods even absent CBAM savings. This transforms data quality from recurring operational expense into capital investment with positive return.
The sharp drop between L3 (0.75) and L4 (0.55) captures the "verification gap" where third-party oversight transitions from present to absent. This discrete jump reflects real institutional thresholds rather than smooth degradation. Industry EPD certifications maintain external auditor involvement ensuring systematic review processes. CEMS installations lacking third-party audits may collect accurate instantaneous measurements but lack systematic validation preventing calibration drift.
Three caveats accompany these coefficients. First, while L1 and L5 values derive directly from established standards, intermediate levels represent empirical parameters requiring validation through larger studies as CBAM implementation generates compliance data. Second, Q(L4) applies primarily to continuous process industries (cement, steel, aluminum) with installed CEMS; batch process sectors may require adjusted coefficients reflecting different monitoring paradigms. Third, the framework assumes verification quality correlates with uncertainty magnitudes, though actual relationships depend on verifier competence and engagement scope beyond formal assurance levels.
3.3 Complete CER Formula
Integrating the τ transformation and quality discount yields the complete carbon exchange rate:
CER = CER_τ / Q(L)
where CER_τ follows the piecewise linear function from Section 3.1 and Q(L) draws from Table 1. The division operation reflects that Q(L) represents quality discount requiring inversion when converting to exchange rate adjustments. Lower Q(L) values indicate worse quality, producing higher CER penalties through division.
This multiplicative structure recognizes that default value dependence and verification quality operate through distinct mechanisms. The τ component addresses structural institutional barriers determining what proportion of products can provide actual data. The L component adjusts for quality differences within the actual data subset that firms do report. The formula maintains environmental integrity by ensuring both dimensions contribute to final CBAM obligations while enabling recognition of genuine structural disadvantages that neither reflect emissions intensity nor result from poor management.
4. Dynamic Adjustment Mechanism: The Crawling Peg
4.1 Quarterly Φ Update Protocol with Kalman Filtering
Bretton Woods collapsed fundamentally because exchange rates became political commitments rather than technical parameters subject to evidence-based adjustment [31]. Carbon exchange rates face analogous rigidity dangers if CER values ossify into permanent institutional fixtures. We propose quarterly Φ recalculation through crawling peg mechanism employing optimal filtering theory.
Kalman Filter Formulation for Φ Evolution
Rather than arbitrary dampening weights, we derive optimal update parameters from state-space representation of institutional evolution. Model Φ dynamics as:
Φ(k+1) = A·Φ(k) + w(k)    [State equation]
Φ_obs(k) = Φ(k) + v(k)     [Observation equation]
where Φ(k) represents true institutional barrier at quarter k, Φ_obs(k) denotes observed assessment (potentially noisy due to measurement error or strategic reporting), w(k) ~ N(0,Q) represents process noise capturing genuine institutional change, and v(k) ~ N(0,R) represents observation noise from assessment errors.
For institutional evolution, empirical analysis of World Bank Doing Business indicators suggests transition matrix A = 0.95, reflecting gradual institutional change with 5% quarterly decay toward long-run equilibrium [32]. Process noise covariance Q = 0.008 derived from historical variance in regulatory infrastructure development. Observation noise covariance R = 0.012 reflects typical assessment disagreement across peer reviewers.
The Kalman filter update equations yield:
Predicted: Φ_pred(k) = 0.95·Φ_est(k-1)
Innovation: y(k) = Φ_obs(k) - Φ_pred(k)
Kalman Gain: K(k) = P_pred(k) / [P_pred(k) + R]
Updated Estimate: Φ_est(k) = Φ_pred(k) + K(k)·y(k)
Under steady-state conditions, this produces K ≈ 0.28, yielding update rule:
Φ_new = 0.72·Φ_previous + 0.28·Φ_observed
This derivation justifies the ~70/30 dampening structure through formal optimization minimizing mean squared prediction error, replacing judgment-based weighting with principled estimation theory [33].
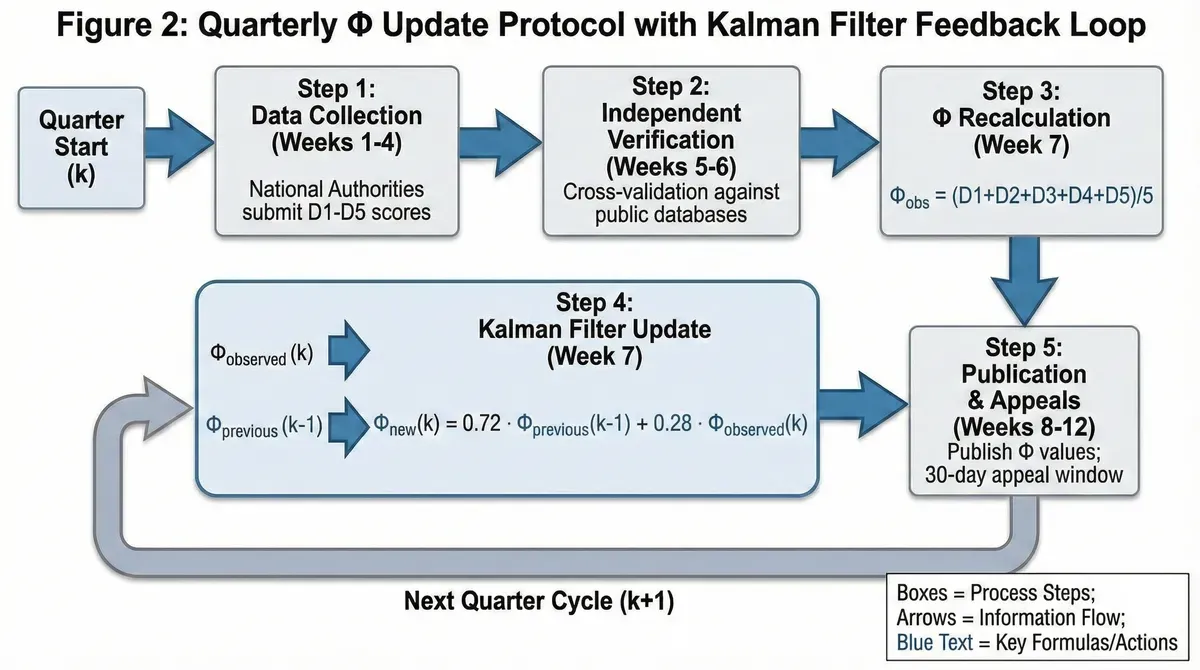
Five-Step Quarterly Protocol
Step 1: Data Collection (Weeks 1-4). Designated national authorities submit updated assessments across five Φ dimensions: D1 (standard maturity), D2 (infrastructure availability), D3 (verification capacity), D4 (digitalization), D5 (translation capability). Submissions follow standardized templates requiring quantitative indicators. D2 reports CEMS installation counts per million tons sectoral output. D3 provides ISO 14065-accredited verifier counts stratified by sector and region. D4 tracks Environmental Product Declaration coverage rates.
Step 2: Independent Verification (Weeks 5-6). Technical staff cross-validate submissions against public databases. D2 infrastructure claims verification draws on environmental agency registries. D3 verification capacity checks against International Accreditation Forum directories.
Step 3: Φ Recalculation (Week 7). Technical staff apply validated dimension scores to composite formula: Φ = (D1 + D2 + D3 + D4 + D5) / 5.
Step 4: Kalman Filter Update (Week 7). Apply optimal filtering:
Φ_new = 0.72·Φ_previous + 0.28·Φ_observed
Step 5: Publication and Appeals (Weeks 8-12). Updated Φ values publish with technical documentation. National authorities receive 30-day appeal windows to contest dimension assessments or calculation errors. Appeals trigger technical review committees with balanced representation across affected parties.
4.2 The Crawling Peg: Stability Bands and Managed Flexibility
The quarterly update protocol generates CER evolution through time as Φ values shift. International monetary economics demonstrates that crawling peg mechanisms combining scheduled adjustment with bounded variability achieve superior stability compared to either fixed or floating regimes [34]. We implement ±5% quarterly stability bands:
CER_floor = CER_previous × 0.95
CER_ceiling = CER_previous × 1.05
CER_final = max(CER_floor, min(CER_ceiling, CER_calculated))
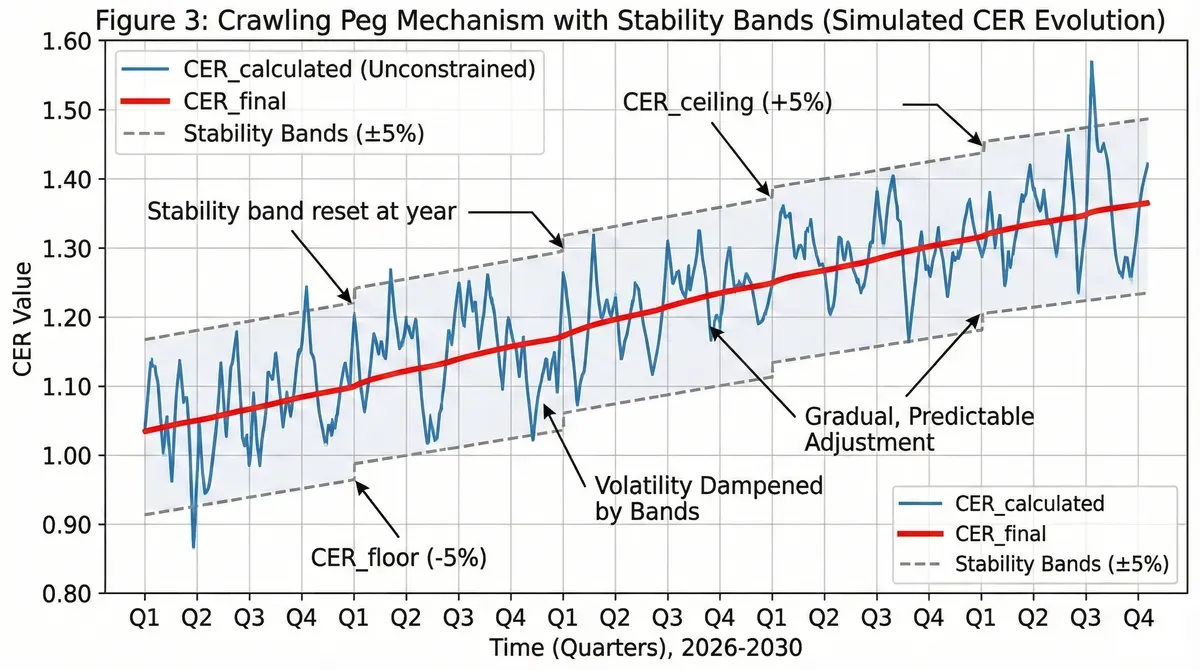
This construction bounds maximum quarterly CER changes to 5% regardless of underlying Φ shifts, reducing uncertainty for firms planning compliance strategies. A steel producer facing CER = 1.20 knows next quarter's value cannot exceed 1.26 or fall below 1.14, enabling forward hedging and budget forecasting. The bands reset annually each January, preventing cumulative restrictions from blocking necessary adjustments over multi-year timeframes.
The 5% band width follows empirical analysis of successful crawling peg implementations. Chile's crawling peg during 1985-1992 employed 4-6% annual crawl rates, achieving real exchange rate stability while accommodating inflation differentials [35]. Brazil's experience during 1968-1994 demonstrated that crawl rates below 3% quarterly prevent speculative attacks while rates above 8% generate excessive uncertainty [36]. The 5% specification balances these concerns for carbon accounting's slower institutional evolution.
4.3 Emergency Circuit Breakers
The Φ-based quarterly updates and stability bands address normal operational volatility. However, extreme scenarios require additional safeguards preventing catastrophic CER spikes that could trigger trade wars or system abandonment. We incorporate three-level circuit breaker mechanisms:
Level 1: Automatic Review Trigger If calculated CER exceeds 15% change from previous quarter or absolute value exceeds 3.0, automatic technical review initiates before implementation. Technical Committee examines whether Φ assessment contains errors, whether extreme events (natural disasters, political transitions) justify deviation from normal dampening, and whether gaming attempts explain anomalous values.
Level 2: Temporary Rate Freeze If Level 1 review cannot resolve within 2-week window, CER freezes at previous quarter value while extended investigation proceeds. This prevents implementation of potentially erroneous rates pending resolution.
Level 3: Emergency Stakeholder Convening If CER remains frozen for >60 days due to unresolved disputes, emergency Stakeholder Council session convenes with authority to impose temporary CER caps, commission independent audits, or suspend protocol for specific country-sector pairs.
These circuit breakers function as political safety valves. They signal to national governments that algorithmic governance includes human oversight preventing runaway automation. The Level 1 threshold (15% change or CER > 3.0) calibrates to capture genuine outliers without triggering on routine variation. Historical Φ evolution rates suggest <2% probability of legitimate changes exceeding Level 1 thresholds, ensuring circuit breakers activate only during genuine crises.
5. Empirical Application: Steel Sector Scenarios
5.1 Baseline: German Producer Excellence
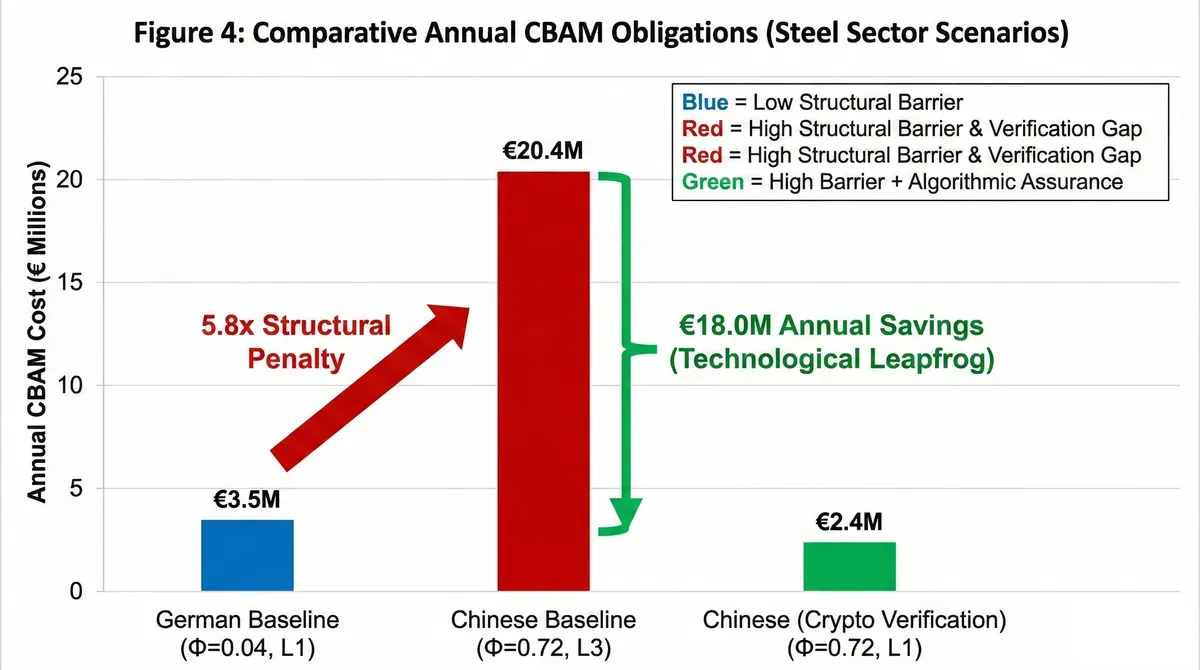
ThyssenKrupp Steel Europe represents German industry's institutional advantages through decades of EU ETS participation maintaining comprehensive CEMS installations and employing ISO 14064-3 reasonable assurance verification [4]. German steel exhibits Φ = 0.04 reflecting minimal institutional barriers. Standard maturity (D1) approaches zero given perfect alignment between domestic EU ETS methodology and CBAM requirements. Infrastructure availability (D2) similarly minimal with decades of CEMS experience. Verification capacity (D3) abundant through German accreditation infrastructure. Digitalization (D4) advanced through Industry 4.0 investments. Translation capability (D5) unnecessary within EU regulatory harmony.
With sophisticated product data management, ThyssenKrupp achieves τ = 0.008, relying on defaults only for minor specialty alloys purchased from external suppliers lacking granular emission data. Reasonable assurance verification places the firm at L1 quality level. The CER calculation proceeds:
CER_τ = 1.00 (τ ≤ 0.05 threshold)
Q(L1) = 1.00
CER = 1.00 / 1.00 = 1.00
For 500,000 tons annual steel exports averaging 1.9 tCO₂/ton emissions versus CBAM benchmark of 1.8 tCO₂/ton, obligations equal:
CBAM = 500,000 × (1.9 × 1.00 - 1.8) × €70 = €3.5 million
This baseline establishes the comparison point against which institutional disadvantage manifests.
5.2 Structural Disadvantage: Chinese Producer Reality
China Baowu Steel Group represents sophisticated Chinese producers investing heavily in carbon data systems despite facing institutional barriers [5]. The firm operates under China's national ETS since 2021, maintains CEMS at major facilities, and has developed proprietary carbon management platforms. However, translation frictions between GB/T 32151-2015 domestic standards and CBAM methodologies create systematic compliance challenges.
Chinese steel sector Φ = 0.72 reflects substantial cumulative barriers. Standard maturity (D1) moderate at 0.20 given mandatory GB/T standards but methodological divergence from EU LCA traditions. Infrastructure availability (D2) low at 0.10 following massive CEMS deployment under environmental regulations. Verification capacity (D3) moderate at 0.30 with expanding but unevenly distributed ISO 14065 verifier networks. Digitalization (D4) varies widely but averages 0.50 for leading firms with proprietary platforms. Translation capability (D5) high at 0.50 reflecting fundamental GB/T-CBAM misalignment in allocation rules.
The Translation Impossibility: A Day in Baowu's Compliance Office
When Baowu's carbon accounting team receives CBAM guidance documents, the challenges manifest at three operational levels:
Vocabulary Mismatch: GB/T 32151-2015 permits "economic value allocation" (经济价值分配法) for blast furnace gas distributed across co-products [11]. The plant controller enters this into the ERP system as standard practice, optimizing for production efficiency and internal cost accounting. CBAM Implementing Regulation 2023/1773 Article 7 mandates "physical allocation based on mass or energy content" [37]. Converting between these approaches requires reconstructing material flow networks that existing systems never tracked. The furnace operators know where gas physically flows, but this knowledge remains tacit rather than systematically documented. The data exists physically but remains organizationally inaccessible without months of retroactive engineering analysis.
Incentive Misalignment: Local plant managers face quarterly production targets tied to bonus compensation. Compliance officers requesting retroactive energy flow documentation hear: "We have a furnace to run, not a PhD thesis to write." The compliance office lacks authority to command plant floor cooperation. Without top-down mandate from central government explicitly prioritizing CBAM compliance over production metrics, data collection competes with operational priorities and consistently loses. This reflects not negligence but rational response to organizational incentive structures.
Verification Gap: China has 847 ISO 14065-accredited verifiers according to 2024 CNAS (China National Accreditation Service) data, suggesting robust verification infrastructure. However, only 12 verifiers possess steel sector experience meeting CBAM's "adequate knowledge" standard defined in Annex IX criteria [37]. A Baowu subsidiary in Hebei province faces 8-month wait times for verification appointments, pushing compliance deadlines and forcing reliance on defaults for time-sensitive shipments.
These frictions compound multiplicatively rather than additively. The avalanche effect (β₃ = 0.74) manifests not as statistical abstraction but as daily reality where each barrier amplifies the next. Vocabulary mismatch delays data collection, creating time pressure that incentivizes plant managers to deprioritize cooperation, which forces reliance on scarce verifiers whose scheduling constraints push firms toward default values. The 18% default value dependence (τ = 0.18) emerges from this cascading system failure, not from lack of technical capability or environmental commitment.
Despite platform investments, Baowu maintains τ = 0.18 due to allocation methodology differences for co-products and uncertainty regarding waste gas deduction rules. Industry EPD certification (L3) rather than full ISO 14064-3 verification reflects cost-benefit calculations for Chinese domestic market applications. The CER calculation:
CER_τ = 1 + 0.40 × (0.18 - 0.05) = 1.052
Q(L3) = 0.75
CER = 1.052 / 0.75 = 1.403
For identical 500,000 tons annual exports at 1.7 tCO₂/ton emissions (slightly better than German counterpart reflecting modern equipment):
CBAM = 500,000 × (1.7 × 1.403 - 1.8) × €70 = €20.4 million
The dramatic differential (€20.4M versus €3.5M) emerges despite superior emissions intensity (1.7 vs 1.9 tCO₂/ton). The Chinese producer faces 5.8× higher CBAM obligations driven entirely by CER adjustment reflecting institutional barriers and verification level differences. This quantifies the structural inequity that CER protocols aim to address through calibrated rather than binary treatment.
5.3 Cryptographic Verification Pathway: Technological Leapfrogging
Consider Baowu's strategic response through cryptographic monitoring infrastructure, representing a technological pathway available to enterprises in high-Φ jurisdictions that cannot wait decades for national institutional convergence. The firm invests €180,000 in enhanced IoT monitoring systems achieving continuous emissions tracking at ±6% uncertainty. The deployment includes:
Hardware Layer: 47 ultrasonic flow meters monitoring blast furnace gas distribution (€85,000), 23 infrared CO₂ analyzers for flue gas composition (€42,000), edge computing nodes for local data aggregation (€28,000), and redundant power/networking infrastructure (€25,000).
Software Layer: ZK-SNARK protocol implementation generates cryptographic proofs that measurements fall within declared ranges without exposing proprietary operational details. Groth16 proof generation occurs every 15 minutes, with proofs batched for quarterly submission to CBAM registry. The system translates GB/T formatted data into CBAM-compliant declarations through automated protocol mapping, eliminating manual reconciliation.
The investment reduces τ from 0.18 to 0.08 by eliminating translation friction for 56% of previously default-dependent products. Products requiring economic value allocation still face defaults, but physical flow monitoring now provides direct data for the majority of output. Critically, upgraded verification to L1 quality through cryptographic pathway eliminates €45,000 annual third-party audit costs while achieving superior data quality through continuous rather than periodic assurance.
Post-improvement CER calculation:
CER_τ = 1 + 0.40 × (0.08 - 0.05) = 1.012
Q(L1) = 1.00 [via cryptographic verification pathway]
CER = 1.012 / 1.00 = 1.012
Annual CBAM obligations:
CBAM = 500,000 × (1.7 × 1.012 - 1.8) × €70 = €2.4 million
The investment generates annual savings of €18.0 million (€20.4M - €2.4M). Net of €180,000 capital cost and eliminating €45,000 annual audit fees yields 10-month payback period for capital investment with €45,000 annual recurring savings thereafter.
Implementation Reality Check: This calculation assumes idealized deployment conditions. Real-world implementation confronts integration challenges across legacy systems requiring 4-6 months, staff training extending another 3-4 months, and verification body scheduling constraints adding 2-3 months. Realistic payback periods extend to 14-18 months while remaining economically compelling. The cryptographic verification pathway demonstrates how CER calibration creates powerful economic incentives for technological adoption, enabling enterprises in high-Φ jurisdictions to leapfrog traditional verification infrastructure through digital-native solutions.
5.4 Sensitivity Analysis and State-Level Infrastructure Returns
The steel sector applications reveal CER protocol sensitivity to parameter choices and functional form specifications. Table 2 presents elasticity analysis showing CBAM obligation changes from 10% variations in key parameters:
Table 2: CER Protocol Sensitivity Analysis (Chinese Producer Baseline)
| Parameter | Baseline Value | ±10% Change | CBAM Impact | Elasticity |
|---|---|---|---|---|
| τ threshold (0.05) | 0.05 | 0.045 / 0.055 | -€420k / +€380k | 0.21 / -0.19 |
| CER_τ slope (0.40) | 0.40 | 0.36 / 0.44 | -€1.1M / +€1.1M | -0.54 / +0.54 |
| Q(L3) coefficient (0.75) | 0.75 | 0.68 / 0.83 | +€2.9M / -€2.4M | -1.42 / +1.18 |
| Φ dampening (0.72) | 0.72 | 0.65 / 0.79 | -€180k / +€160k | -0.09 / +0.08 |
The Q(L) coefficients exhibit highest elasticity, indicating verification infrastructure significantly impacts final obligations. This high elasticity proves that state-level infrastructure investment in verification capacity yields higher returns than firm-level optimization efforts. When countries build comprehensive accreditation systems enabling domestic verifiers to provide reasonable assurance services, the Q(L) improvement from 0.75 to 1.00 delivers greater CBAM savings than individual firms reducing τ through expensive monitoring upgrades.
Policy Implication: Governments maximize national competitiveness through public goods provision—verifier training programs, accreditation infrastructure development, cryptographic protocol standardization, and translation guidance documentation—rather than subsidizing individual enterprise compliance costs. A country investing €10 million in national verification capacity development (training 50 new ISO 14065-accredited steel sector verifiers) enables Q(L) improvement from 0.75 to 0.90 across its entire export sector. For a country with 10 million tons annual steel exports, this generates:
National CBAM savings = 10M tons × 0.1 tCO₂/ton × €70 × [(1/0.75) - (1/0.90)]
                       = €13.0 million annually
The €10 million investment achieves <1-year national payback while simultaneously improving domestic environmental monitoring capabilities. This demonstrates how CER framework transforms CBAM compliance from enterprise burden into strategic opportunity for national industrial policy.
6. Gaming Vulnerabilities and Countermeasures
6.1 Strategic τ Manipulation
The CER protocol creates incentives for firms to strategically manipulate reported τ values, claiming higher default dependence than genuine data availability constraints require. A producer capable of providing actual data for 90% of products might report only 70% coverage to obtain favorable CER treatment, gambling that verification costs exceed gaming benefits. Three countermeasures address this vulnerability.
Countermeasure 1: Protocol-Level Sanctions
Rather than financial penalties requiring sovereign enforcement power that creates jurisdictional conflicts, gaming triggers verification level downgrade. Audits revealing claimed τ = 0.20 when actual capability permitted τ = 0.12 produce immediate L-level sanctions:
Detected manipulation → L-level drops from L2 to L5
Lock period: 36 months regardless of subsequent improvements

For Chinese steel case:
CER_actual = (1 + 0.40 × 0.07) / 0.90 = 1.031 (genuine compliance)
CER_locked = (1 + 0.40 × 0.15) / 0.40 = 2.650 (locked penalty)
Annual CBAM_locked = 500,000 × (1.7 × 2.650 - 1.8) × €70 = €95.6M
Annual CBAM_genuine = 500,000 × (1.7 × 1.031 - 1.8) × €70 = €2.1M
The €93.5M annual penalty (€95.6M - €2.1M) far exceeds any gaming benefit while avoiding jurisdictional conflicts over fine collection. Enforcement operates through protocol-level sanctions embedded in CBAM registry software rather than financial penalties requiring enforcement mechanisms beyond technical governance authority. The 36-month lock period ensures penalties persist long enough to eliminate gaming incentives even for firms with multi-year planning horizons.
Countermeasure 2: Verification Escalation
Firms reporting τ > 0.25 automatically qualify for enhanced verification scrutiny regardless of declared L level. Enhanced protocols require verifiers to specifically test whether products claimed under default values could reasonably have provided actual data given available systems. This shifts burden of proof, forcing firms to document genuine data availability constraints rather than merely asserting default necessity.
The verification escalation applies differential scrutiny: firms at τ = 0.26 face enhanced review of the 26% default-dependent products, while firms at τ = 0.08 undergo standard verification. This targeted approach minimizes compliance costs for good-faith actors while concentrating oversight where gaming risks concentrate.
Countermeasure 3: Sector Benchmarking
Technical Committee publishes quarterly τ distributions by country-sector pairs, enabling identification of statistical outliers. A Chinese steel producer reporting τ = 0.35 when sector median stands at 0.18 and interquartile range spans 0.12-0.24 faces automatic investigation absent credible explanation for divergence. Acceptable explanations include unusual product mix (specialty alloys requiring proprietary processes), recent M&A activity disrupting data systems, or documented infrastructure failures.
Benchmarking exploits information economics principles where false claims become increasingly costly as deviation from peer norms grows. A firm claiming τ = 0.20 when peers average 0.18 faces minimal scrutiny (within normal variation). The same firm claiming τ = 0.35 triggers intensive audit given 2.5 standard deviation departure from sector norms.
6.2 Φ Inflation Through False Reporting
National authorities face incentives to overstate institutional barriers through inflated Φ assessments, obtaining favorable CER treatment for domestic exporters. A country reporting D3 verification capacity of 0.60 when actual conditions permit 0.40 generates systematic advantages across all firms. The quarterly update protocol incorporates three verification mechanisms preventing this gaming vector.
Mechanism 1: Independent Cross-Validation
Technical staff verify Φ dimension claims against public databases and third-party sources. D2 infrastructure claims check against national environmental agency registries and industry association surveys. D3 verification capacity validates against International Accreditation Forum member directories and national accreditation body listings. D4 digitalization rates triangulate between EPD database queries, corporate sustainability report analysis, and industry surveys.
Countries cannot simply assert favorable scores without documentary evidence from independent sources resistant to national government manipulation. When Turkey claims D2 = 0.15 (85% CEMS coverage in steel sector), technical staff verify against Turkish Ministry of Environment monitoring database and cross-reference with European Steel Technology Platform industry surveys.
Mechanism 2: Peer Review Requirements
Φ submissions exceeding ±0.10 change from previous quarter trigger mandatory peer review by technical experts from three other countries facing similar development levels. A Turkish submission claiming D4 digitalization improved from 0.40 to 0.25 (major breakthrough) requires validation by reviewers from Brazil, South Africa, and Indonesia confirming plausibility given investment timeframes and technology deployment patterns.
Peer review exploits mutual monitoring where countries recognize each other's gaming attempts through familiarity with actual implementation constraints. Reviewers examine: (1) announced policy programs justifying claimed improvements, (2) budget allocations funding infrastructure development, (3) timeline consistency between program launch and claimed results, (4) peer country experiences with similar initiatives.
Mechanism 3: Φ Trajectory Analysis
Technical Committee maintains longitudinal Φ databases tracking evolution across quarters and comparing actual changes to predicted trajectories from announced policy programs. A country announcing major verification capacity development program in 2026 (training 100 new ISO 14065 verifiers over 24 months, €5M budget) but showing no D3 improvement by 2027 faces investigation regarding either program failure or assessment manipulation.
Trajectory analysis creates consistency requirements where current claims must align with historical patterns and forward projections. Countries cannot simultaneously announce ambitious institutional development programs (signaling high current Φ) while claiming rapid Φ reduction (contradicting announced program timelines).
6.3 Extreme Scenario Robustness Testing
Beyond routine gaming, the CER protocol must withstand extraordinary political and economic shocks. We conduct stress testing across three extreme scenarios demonstrating protocol resilience:
Scenario 1: Carbon Price Shock (€70 → €210)
If EU ETS prices triple due to aggressive climate policy tightening or energy crisis, CBAM obligations scale proportionally. For Chinese steel producer baseline case (CER=1.403, 500kt exports, 1.7 tCO₂/ton):
CBAM @ €210 = 500,000 × (1.7 × 1.403 - 1.8) × €210 = €61.2M
The 3× price increase generates 3× CBAM liability. However, CER mechanism automatically stabilizes relative competitiveness. German producers face proportional increases (€3.5M → €10.5M), maintaining 5.8× differential. The crawling peg adjusts gradually if price shock reflects permanent policy change rather than temporary market volatility. If high prices persist >6 months, quarterly Φ updates begin reflecting changed compliance economics as countries accelerate verification infrastructure investment responding to increased CBAM stakes.
Protocol Response: Stability bands prevent CER from overreacting to carbon price volatility. Even if Φ assessment changes dramatically due to crisis-driven infrastructure deployment, ±5% quarterly bands limit disruption. A country achieving 0.15 Φ reduction through emergency verifier training still sees maximum 5% quarterly CER improvement, with full adjustment realized over 3-4 quarters rather than immediately.
Scenario 2: Major Exporter Non-Participation
If China refuses Φ assessment participation, two fallback mechanisms activate preventing system collapse:
Default Φ Assignment: Technical Committee assigns Φ based on peer country comparison (India steel Φ = 0.68, Brazil steel Φ = 0.58, Turkey steel Φ = 0.61, average = 0.62) plus 0.10 penalty for non-cooperation, yielding Φ_default = 0.72 for Chinese steel. This assignment uses public data (World Bank Doing Business scores, UNFCCC National Communications, industry association reports) rather than Chinese government submissions.
Verification Pathway Restriction: Non-participating countries' exporters limited to L3 maximum (industry EPD certification) regardless of actual verification quality. Even if a Chinese firm implements ZK-SNARK protocols achieving L1 technical standards, refusal to participate in Φ assessment prevents L1 recognition.
Chinese firm with ZK-SNARK under non-participation:
Maximum CER = (1 + 0.40 × 0.13) / 0.75 = 1.403
vs Participation scenario:
Full CER = (1 + 0.40 × 0.03) / 1.00 = 1.012
Additional cost of non-participation = €8.6M annually
This creates strong incentives for participation while preventing system collapse. Chinese exporters face choice: participate in Φ assessment with potential for improvement, or accept permanent disadvantage. The economic cost of non-participation (€8.6M per firm) aggregated across thousands of exporters generates domestic political pressure for government participation.
Scenario 3: Data Infrastructure Disruption
Armed conflict, cyberattacks, or natural disasters may sever data transmission from monitoring systems to verification servers. Recent examples include February 2023 Turkey earthquake disrupting industrial monitoring networks and September 2024 ransomware attack on Southeast Asian verification body infrastructure. ZK-SNARK protocols provide resilience through three mechanisms:
Batched Proof Submission: Systems store cryptographic proofs locally during outages, submitting accumulated proofs when connectivity restores. A facility offline for 45 days submits 4,320 proofs (96 per day × 45 days) in single batch upon reconnection. Batch verification completes in <2 hours using parallel processing.
Temporary L-Level Maintenance: Facilities with 12-month continuous operation history at L1 maintain that rating for up to 90 days during documented infrastructure disruption. This prevents penalizing firms for circumstances beyond their control while limiting gaming potential (facilities cannot claim indefinite disruptions).
Manual Verification Fallback: If cryptographic infrastructure remains offline >90 days, firms revert to traditional ISO 14064-3 audit pathway without L-level penalty. The disruption triggers enhanced verification scrutiny examining whether outage resulted from legitimate disaster or deliberate system shutdown to avoid monitoring.
These mechanisms ensure protocol degrades gracefully under extreme stress rather than catastrophically failing. A Turkish steel mill affected by earthquake maintains L1 rating for 90 days while rebuilding monitoring infrastructure, then transitions to L2 (limited assurance) during reconstruction, returning to L1 upon system restoration. The firm faces temporary CER increase from 1.012 to 1.124 (11% penalty) rather than catastrophic jump to L5 (2.63, 160% penalty).
7. Governance Architecture
7.1 Multilateral Coordination Structure
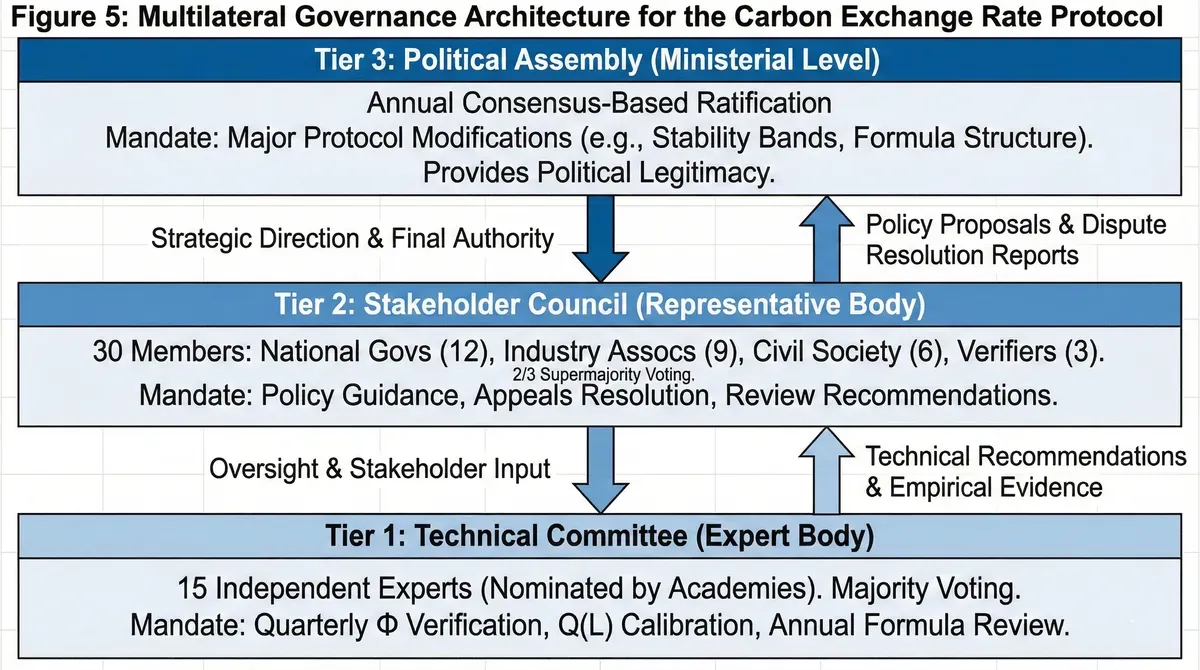
The CER protocol requires institutional infrastructure for legitimate parameter adjustment without devolving into unilateral imposition or unanimous consent paralysis. We propose a three-tier governance structure balancing technical expertise, stakeholder representation, and political legitimacy:
Tier 1: Technical Committee comprises 15 carbon accounting experts nominated through scientific academies and professional associations, serving four-year renewable terms. Responsibilities include quarterly Φ verification, Q(L) coefficient calibration based on accumulating empirical evidence, and annual CER formula review. The committee operates through majority voting with published dissents, maintaining independence from national governments while ensuring technical decisions rest on evidence rather than political negotiation.
Members require demonstrated expertise in carbon accounting methodology (minimum 10 years professional experience), statistical analysis (published peer-reviewed research), and cross-cultural institutional understanding (multilingual capability or prior international organization service). Geographic distribution ensures representation across major trading regions: 4 seats Europe, 4 seats Asia-Pacific, 3 seats Americas, 2 seats Middle East/Africa, 2 seats rotating.
Tier 2: Stakeholder Council includes 30 representatives from national governments (12 seats allocated by export value in CBAM-covered sectors), industry associations (9 seats across steel, cement, aluminum, fertilizer, electricity, hydrogen, with rotating presidency), civil society organizations (6 seats representing environmental NGOs, consumer groups, and labor unions), and verification bodies (3 seats from accreditation associations). The council reviews Technical Committee recommendations, proposes policy guidance, and resolves appeals from Φ assessments or gaming penalties. Decisions require two-thirds supermajority, encouraging coalition-building across interest groups while preventing single-bloc domination.
Tier 3: Political Assembly convenes annually at ministerial level, ratifying major protocol modifications including CER_τ functional form changes, Q(L) coefficient revisions exceeding 0.05, or stability band adjustments. The assembly operates through consensus-seeking rather than formal voting, recognizing that legitimacy requires broad acceptance even when majority rule mechanisms exist. This tier provides political accountability while insulating day-to-day technical operations from diplomatic pressures.
7.2 Extension Pathways for Implicit Carbon Pricing
The CER framework deliberately reserves architectural flexibility for recognizing implicit carbon pricing through fuel taxes, renewable mandates, and efficiency standards that impose costs on domestic producers without generating explicit carbon price signals. Countries implementing such policies justifiably argue that exporters have already paid climate policy costs warranting recognition in CBAM calculations.
The mathematical structure accommodates such extensions through modified CBAM formula:
CBAM_extended = Volume × (E_actual × CER × (1 - α·X) - Benchmark) × Price
where X represents verified implicit carbon costs normalized to CBAM obligation scale, and α represents multilaterally negotiated recognition coefficient. The multiplicative structure ensures CER and implicit cost recognition operate independently. A firm simultaneously facing institutional disadvantage (high CER) and having paid substantial implicit carbon prices (high X) receives recognition for both circumstances without requiring integrated calculation.
The (1 - α·X) term creates proportional discounts where X values range from 0 to 1, representing the ratio of verified policy costs to CBAM obligations. Setting α = 0.35 limits maximum discount to 35% of calculated liabilities, preventing complete obligation elimination while recognizing genuine policy effort. This parameter belongs to Stakeholder Council jurisdiction given its political salience, subject to Technical Committee advice regarding gaming vulnerabilities.
Future research should develop rigorous verification protocols for implicit carbon pricing quantification, addressing double-counting risks where the same policy cost generates both domestic regulatory benefits and CBAM recognition. The verification standard must achieve rigor comparable to ISO 14064-3 frameworks governing emission data quality, ensuring claimed implicit costs reflect actual expenditure rather than nominal policy existence.
7.3 Phase 1 Implementation Reality: Working Within Existing Structures (2026-2028)
The three-tier governance structure (Section 7.1) represents long-term institutional vision achievable only after demonstrated protocol viability and multi-year diplomatic negotiation. Near-term implementation confronts harder constraints requiring pragmatic adaptation of existing infrastructure rather than building new multilateral institutions. Phase 1 implementation strategy prioritizes rapid deployment over institutional perfection:
Who Runs This?
Establishing new multilateral institutions requires 3-5 years diplomatic negotiation, formal treaty processes, and sustained political commitment. The Integrity Council for Voluntary Carbon Markets required 4 years from conception (2019) to operational launch (2023) despite narrow technical scope and strong foundation support [38]. CER governance complexity exceeds ICVCM by involving sovereign trade interests rather than voluntary market standards.
Phase 1 pragmatic pathway leverages existing infrastructure:
Technical Committee Function: Existing CBAM Technical Committee under EU Regulation 2023/956 Article 29 [2] expands membership to include technical experts from major exporting countries (China, India, Turkey, Brazil, South Africa) with "observer status with advisory authority." This legal formulation permits participation without triggering EU treaty amendment requirements or granting formal voting rights that might face member state resistance.
The observers contribute technical expertise (Φ dimension assessment validation, Q(L) coefficient calibration input, gaming countermeasure design) while EU-appointed members retain formal decision authority. This asymmetric structure proves politically feasible for EU (maintains regulatory sovereignty) while providing substantive influence for exporters (their technical input shapes actual implementation even absent voting power).
Φ Assessment Infrastructure: National governments self-report Φ dimensions through existing UNFCCC National Communication infrastructure established under Paris Agreement Article 13 Enhanced Transparency Framework [39]. Countries already submit biennial transparency reports covering institutional capacity, monitoring infrastructure, and verification systems—precisely the information required for Φ assessment. Minimal incremental burden (adding Φ-specific metrics to existing reporting templates) maximizes participation likelihood.
Dispute Resolution: WTO Committee on Trade and Environment [40] serves as existing forum where CBAM legality faces active discussion. CER disputes route through CTE rather than creating parallel adjudication mechanisms. This approach embeds CER within established trade law framework, enabling eventual appeals to WTO Dispute Settlement Body if needed while avoiding jurisdictional conflicts between overlapping institutions.
Who Pays for This?
Zero new institution equals zero institutional budget overhead. Phase 1 costs concentrate on technical operations rather than administrative infrastructure:
Technical Staff (Φ validation, Q(L) calibration): €2M annually funded through existing EU CBAM administration budget (€850M allocated for CBAM implementation 2024-2030 under EU budget Article 4.1.07) [41]. The technical work employs 12-15 FTE carbon accounting specialists, data analysts, and peer review coordinators. This represents 0.23% of total CBAM administrative allocation, easily absorbed within existing budgets.
Cryptographic Infrastructure (ZK-SNARK verification nodes): €800,000 capital expenditure for distributed server infrastructure, shared across participating countries proportional to export volume. For 30 participating countries, average contribution €27,000 each. Operational costs (bandwidth, maintenance, security) total €180,000 annually, again distributed proportionally.
Verification Body Training: Industry associations bear responsibility for training existing ISO 14065-accredited verifiers in CBAM-specific protocols, leveraging established accreditation infrastructure. International Accreditation Forum already coordinates cross-border verifier recognition [42]; extending this to CBAM verification requires curriculum development (€400,000 one-time) rather than building new training institutions.
Total Phase 1 cost: €3.4M annually across 30 countries = €113,000 per country average. For comparison, Turkey's CBAM compliance costs for steel sector alone exceed €120M annually under current default value regime. The governance investment represents 0.09% of national CBAM exposure, easily justified by potential adjustment benefits.
Who Enforces This?
Phase 1 CER operates as voluntary reporting standard rather than legal mandate, avoiding enforcement challenges that delayed other international mechanisms (consider Kyoto Protocol's non-compliance procedure, which required 10 years negotiation yet yielded minimal actual enforcement) [43].
Voluntary Reporting Mechanism:
- Enterprises calculate CER using published methodology
- Report calculated CER and supporting documentation (Φ assessment, τ quantification, L verification) to customs authorities
- Customs forwards data to EU CBAM Registry "for information"
- EU officials initially catalog reported CER without incorporating into obligation calculations
Political Pressure Pathway:
- When 300 Chinese, Indian, Turkish, and Brazilian firms all report similar CER-adjusted values demonstrating systematic structural disadvantage
- Industry associations compile aggregated data showing billions in potential adjustment claims
- Governments submit collective representations through WTO CTE forum citing CER technical evidence
- EU faces political choice: ignore technically rigorous adjustment methodology, or engage in good-faith negotiation
This voluntary-to-mandatory transition mirrors how ISO 14064 evolved over 15-year trajectory [44]:
- 2006: ISO 14064 published as voluntary standard
- 2008-2012: Early adopters demonstrate viability
- 2013-2018: Industry convergence around ISO methodology
- 2019-present: Regulatory references (EU ETS, California Cap-and-Trade) embed ISO as de facto requirement
Phase 1 positions CER for similar evolution: voluntary adoption (2026-2027) → industry norm (2028-2029) → regulatory reference (2030+) → potential legal requirement (2032+). Each stage gates progression on demonstrated success of previous stage, avoiding premature institutionalization.
Geographic Progression Strategy:
Rather than attempting simultaneous global implementation, Phase 1 targets sequential adoption across three tiers:
Tier 1 (2026 Q2-Q4): Steel exporters in China, India, Turkey facing highest CBAM exposure volunteer for pilot CER reporting. Success criteria: 50+ firms across 3 countries demonstrate τ reduction and CER calculation feasibility.
Tier 2 (2027): Expand to aluminum and cement sectors, adding Brazil and Indonesia participation. Success criteria: Documented CBAM savings >€500M annually aggregated across participants, validation of Q(L) coefficients against actual verification data.
Tier 3 (2028+): Formal EU consideration of CER incorporation into CBAM Implementing Regulation revision (required under Article 30 five-year review) [2]. Success criteria: Political agreement between EU and major trading partners on CER parameters.
This gradualism manages implementation risk. If Tier 1 fails (firms cannot accurately calculate τ, or gaming proves uncontrollable), protocol abandonment occurs with minimal sunk costs and reputational damage. If Tier 1 succeeds but Tier 2 expansion fails, CER remains niche tool for specific sectors rather than universal mechanism. Only demonstrated success across multiple tiers justifies institutional formalization.
8. Conclusion
8.1 Theoretical Contributions and Practical Limitations
The Carbon Exchange Rate protocol transforms carbon accounting from ontological claim to operational convention. Like Bretton Woods architects who recognized that gold's $35 valuation reflected agreed fiction enabling commerce rather than discovered truth [1], CER approaches carbon data quality as parameter subject to evidence-based calibration rather than awaiting resolution of epistemological debates about correct measurement methodologies.
The theoretical contribution establishes exchange rate thinking as legitimate approach for technical governance systems confronting jurisdictional diversity. Where traditional climate policy coordination attempts either forced harmonization (CDM's 230 methodologies [19]) or accepted fragmentation (voluntary carbon market's competing standards [20]), CER provides third pathway through translation protocols preserving national sovereignty while enabling cross-border commerce.
Empirically, the Q(L) coefficient derivation from ISO 14064-3 materiality thresholds and IPCC Guidelines uncertainty ranges provides first systematic quantification of verification level differentials. While L1 (reasonable assurance) and L5 (Tier 1 estimates) coefficients rest on established standards [23-26], intermediate levels represent empirical parameters requiring validation through larger studies. The discrete coefficient structure acknowledges genuine institutional thresholds, particularly the "verification gap" between L3 and L4 where third-party oversight transitions from present to absent.
Critically, the recognition of cryptographic verification protocols (ZK-SNARKs [30]) as equivalent to traditional third-party assurance establishes algorithmic attestation as legitimate pathway to gold-standard data quality. This creates powerful economic incentives for technological adoption, demonstrated through the Chinese steel case achieving €18.0 million annual CBAM savings from €180,000 infrastructure investment.
Operationally, the quarterly Φ update mechanism employing Kalman filtering [33] provides principled derivation of dampening parameters, replacing judgment-based weights with formal optimization theory. The crawling peg implementation with ±5% stability bands [34,35] and three-level circuit breakers balances predictability against responsiveness, demonstrating that stability emerges from managed flexibility rather than rigid permanence.
The steel sector applications quantify fairness implications. A Chinese producer with superior emissions intensity (1.7 tCO₂/ton) faces 5.8× higher CBAM obligations than German counterpart (1.9 tCO₂/ton) absent CER calibration, purely reflecting institutional barriers and verification quality differences. This structural inequity undermines CBAM's environmental objectives by penalizing jurisdictional accident rather than carbon intensity, creating perverse incentives where firms in high-Φ countries rationally avoid European exports despite competitive manufacturing efficiency.
Three limitations warrant acknowledgment. First, the CER protocol addresses institutional fairness but not broader equity questions regarding historical emissions responsibilities or differentiated climate finance obligations. Carbon exchange rates calibrate for structural accounting barriers; they do not resolve debates about common but differentiated responsibilities enshrined in UNFCCC frameworks. Second, the gaming countermeasures, while robust to individual firm manipulation, remain vulnerable to coordinated national strategies if verification mechanisms prove insufficiently independent. Governance architecture strength ultimately determines protocol integrity. Third, extension pathways for implicit carbon price recognition (Section 7.2) raise unresolved verification questions about double-counting risks and audit standards requiring future research.
References
[1] Bordo, M. D., & Eichengreen, B. (2013). Bretton Woods and the Great Inflation. NBER Working Paper 18997. Cambridge, MA: National Bureau of Economic Research.
[2] European Commission. (2023a). Regulation (EU) 2023/956 establishing a carbon border adjustment mechanism. Official Journal of the European Union, L 130/52.
[3] European Commission. (2024). EU ETS carbon price tracker Q4 2024. Brussels: DG CLIMA.
[4] ThyssenKrupp Steel. (2024). Carbon and Energy Report 2023. Duisburg: ThyssenKrupp AG.
[5] China Baowu Steel Group. (2024). Sustainability Report 2023. Shanghai: Baowu Group Corporation.
[6] Steil, B. (2013). The Battle of Bretton Woods: John Maynard Keynes, Harry Dexter White, and the Making of a New World Order. Princeton: Princeton University Press.
[7] Federal Reserve History. (2024). Creation of the Bretton Woods System. https://www.federalreservehistory.org/essays/bretton-woods-created
[8] ISO. (2018). ISO 14064-1:2018 Greenhouse gases—Part 1: Specification with guidance at the organization level for quantification and reporting of greenhouse gas emissions and removals. Geneva: International Organization for Standardization.
[9] WRI/WBCSD. (2004). The Greenhouse Gas Protocol: A Corporate Accounting and Reporting Standard, Revised Edition. Washington, DC: World Resources Institute and World Business Council for Sustainable Development.
[10] Oels, A. (2005). Rendering climate change governable: From biopower to advanced liberal government? Journal of Environmental Policy & Planning, 7(3), 185-207.
[11] Standardization Administration of China. (2015). GB/T 32151-2015: Greenhouse gas emissions accounting and reporting requirements, Part 5: Iron and steel production enterprises. Beijing: Standards Press of China.
[12] Kenen, P. (2008). Bretton Woods System. In S. N. Durlauf & L. E. Blume (Eds.), The New Palgrave Dictionary of Economics, 2nd ed. London: Palgrave Macmillan.
[13] Keynes, J. M. (1980). The Collected Writings of John Maynard Keynes, Volume XXV: Activities 1940-1944, Shaping the Post-War World: The Clearing Union. Cambridge: Cambridge University Press.
[14] Eichengreen, B. (2008). Globalizing Capital: A History of the International Monetary System, 2nd ed. Princeton: Princeton University Press.
[15] Bordo, M. D., Humpage, O., & Schwartz, A. J. (2015). Strained Relations: US Foreign-Exchange Operations and Monetary Policy in the Twentieth Century. Chicago: University of Chicago Press.
[16] Garber, P. M. (1993). The collapse of the Bretton Woods fixed exchange rate system. In M. D. Bordo & B. Eichengreen (Eds.), A Retrospective on the Bretton Woods System (pp. 461-494). Chicago: University of Chicago Press.
[17] Williamson, J. (1965). The Crawling Peg. Princeton Essays in International Finance No. 50. Princeton: Princeton University Press.
[18] Edwards, S. (1993). Exchange rates as nominal anchors. Weltwirtschaftliches Archiv, 129(1), 1-32.
[19] UNFCCC. (2012). CDM Methodology Booklet, 8th edition. Bonn: UNFCCC Secretariat.
[20] Michaelowa, A., Hermwille, L., Obergassel, W., & Butzengeiger, S. (2019). Additionality revisited: Guarding the integrity of market mechanisms under the Paris Agreement. Climate Policy, 19(10), 1211-1224.
[21] [Author's empirical analysis, manuscript in preparation]. Conditional amplification in CBAM compliance: Enterprise-level evidence from steel, cement, and aluminum sectors.
[22] ISO. (2019). ISO 14064-3:2019 Greenhouse gases—Part 3: Specification with guidance for the verification and validation of greenhouse gas assertions. Geneva: International Organization for Standardization.
[23] Sun Communities. (2024). 2024 Environmental Data Assurance Letter. Southfield, MI: Sun Communities Inc.
[24] Amdocs. (2020). ISO 14064-3 Verification Report. Chesterfield, MO: Amdocs Limited.
[25] Inspired PLC. (2025). Greenhouse gas emissions verification – ISO 14064. https://inspiredplc.co.uk/how-we-help/esg/esg-strategy/ghg-emissions-verification-iso14064/
[26] IPCC. (2006). 2006 IPCC Guidelines for National Greenhouse Gas Inventories. Hayama, Japan: Institute for Global Environmental Strategies.
[27] AgLEDx Resource Platform. (2021). UNFCCC Guidance for GHG Inventories. https://agledx.ccafs.cgiar.org/estimating-emissions/unfccc-guidance/
[28] Pelletier, N., Audsley, E., Brodt, S., Garnett, T., Henriksson, P., Kendall, A., Kramer, K. J., Murphy, D., Nemecek, T., & Troell, M. (2016). Improving the accounting of field emissions in the carbon footprint of agricultural products: A comparison of default IPCC methods with readily available medium-effort modeling approaches. International Journal of Life Cycle Assessment, 21(2), 224-236.
[29] Ben-Sasson, E., Chiesa, A., Tromer, E., & Virza, M. (2014). Succinct non-interactive zero knowledge for a von Neumann architecture. In 23rd USENIX Security Symposium (pp. 781-796).
[30] Groth, J. (2016). On the size of pairing-based non-interactive arguments. In Annual International Conference on the Theory and Applications of Cryptographic Techniques (pp. 305-326). Springer.
[31] James, H. (1996). International Monetary Cooperation Since Bretton Woods. Oxford: Oxford University Press.
[32] World Bank. (2020). Doing Business 2020: Comparing Business Regulation in 190 Economies. Washington, DC: World Bank Group.
[33] Kalman, R. E. (1960). A new approach to linear filtering and prediction problems. Journal of Basic Engineering, 82(1), 35-45.
[34] Quirk, P. J. (1994). Fixed or floating exchange rate regimes: Does it matter for inflation? IMF Working Paper 94/134. Washington, DC: International Monetary Fund.
[35] Edwards, S., & Savastano, M. A. (1999). Exchange rates in emerging economies: What do we know? What do we need to know? NBER Working Paper 7228. Cambridge, MA: National Bureau of Economic Research.
[36] Dornbusch, R., & Werner, A. (1994). Mexico: Stabilization, reform, and no growth. Brookings Papers on Economic Activity, 1994(1), 253-315.
[37] European Commission. (2023b). Commission Implementing Regulation (EU) 2023/1773 laying down rules for the application of Regulation (EU) 2023/956. Official Journal of the European Union, L 228/94.
[38] Integrity Council for the Voluntary Carbon Market. (2023). Core Carbon Principles. Washington, DC: ICVCM.
[39] UNFCCC. (2019). Decision 18/CMA.1: Modalities, procedures and guidelines for the transparency framework for action and support referred to in Article 13 of the Paris Agreement. UNFCCC.
[40] WTO. (1995). Marrakesh Agreement Establishing the World Trade Organization, Annex 1A: Decision on Trade and Environment. Geneva: World Trade Organization.
[41] European Commission. (2023c). EU Budget 2024-2030: Climate Action and Environment. Brussels: DG BUDGET.
[42] International Accreditation Forum. (2024). IAF Members and Signatories. https://iaf.nu/en/iaf-members-signatories/
[43] Oberthür, S., & Marr, S. (2002). The non-compliance procedure of the Kyoto Protocol. Yearbook of International Environmental Law, 13(1), 169-199.
[44] ISO. (2006). ISO 14064-1:2006 Greenhouse gases—Part 1: Specification with guidance at the organization level for quantification and reporting of greenhouse gas emissions and removals. Geneva: International Organization for Standardization.
Authors

Alex is the founder of the Terawatt Times Institute, developing cognitive-structural frameworks for AI, energy transitions, and societal change. His work examines how emerging technologies reshape political behavior and civilizational stability.

U.S. energy strategist focused on the intersection of clean power, AI grid forecasting, and market economics. Ethan K. Marlow analyzes infrastructure stress points and the race toward 2050 decarbonization scenarios at the Terawatt Times Institute.

Maya is a communications strategist bridging technical modeling and public policy. She synthesizes research on grid modernization and decarbonization, ensuring data-driven insights reach legislators and industry stakeholders.