U.S. Trade under the EU Carbon Border Adjustment Mechanism in 2026: Current Exposure, Downstream Expansion, Competitiveness and Policy Responses

Alex Yang Liu; Ethan K. Marlow; Perston Hayes
Terawatt Times Institute, Houston TX 77004 USA
Intelligence, Energy and Abundance · Volume 1 (2026)
Abstract
The European Union's Carbon Border Adjustment Mechanism (CBAM) affects U.S. industrial trade through product eligibility, embedded-emissions accounting, default values, verification and prospective certificate costs. This study reconstructs existing exposure using EU27 imports from the United States recorded in Eurostat's CN8 customs data and examines three distinct institutional proposals to extend CBAM to downstream goods. Nominal trade in currently covered codes reached approximately €3.90 billion and 3.04 million metric tons in 2025. The whole-code customs populations associated with the Commission, Council and Parliament proposals are substantially larger, but their merchandise values cannot be interpreted as eligible embedded-metal values or CBAM liabilities. Product-level calculations show how official default intensities, the free-allocation adjustment and access to verified actual emissions can change relative costs across production routes. Ammonia illustrates the commercial significance of default-value differences and the limits of inferring causality from short-run trade shifts. The study identifies classification defects, material-eligibility uncertainty, evidence-access constraints and the need to distinguish legal coverage from economic incidence. It concludes with specific, measurable regulatory and industrial-policy priorities. The findings describe observed trade, conditional accounting scenarios and pending legislation separately.
Keywords: Carbon Border Adjustment Mechanism; United States; European Union; downstream goods; industrial competitiveness; embedded emissions; customs classification; verification; carbon leakage.
1. Research Questions, Legal Objects and the Regulatory Timeline
U.S. participation in the EU market depends on the customs classification of imported products, the production processes that supply them and the evidence accepted by EU authorities. [2, 4, 37] The legal duty to declare and surrender CBAM certificates falls on the authorized declarant, usually an EU importer or qualifying indirect customs representative. [2] U.S. producers nonetheless supply much of the underlying installation information and may bear costs through documentation, contract terms or changes in European purchasing. The principal economic question is how that legal allocation of responsibility affects commercial decisions across individual products and production routes. Regulation (EU) 2023/956 established CBAM, and Regulation (EU) 2025/2083 amended its administration. [2, 3] Its existing product scope includes specified cement, electricity, fertilizers, hydrogen, iron and steel, and aluminum goods. [2, 3] The EU links the mechanism to the Emissions Trading System (EU ETS), where covered installations surrender allowances against verified emissions. [39] The statutory objective is to limit carbon leakage as free allocation is withdrawn from relevant EU production; assessing parity requires comparing legal accounting boundaries, actual production routes and the applicable allocation adjustments. [2, 5, 39]
The reporting-only transition began on October 1, 2023, followed by the definitive regime on January 1, 2026. Importers now face authorization and information requirements for 2026 shipments, whereas purchases of certificates for those imports begin in February 2027 and the first declaration and surrender deadline is September 30, 2027. [2, 3, 10] Pricing and contract negotiations can respond to expected liabilities before the settlement date. Four groups of operative instruments control the detailed measurement. Implementing Regulation (EU) 2025/2547 governs the calculation of embedded emissions, including production processes and precursor accounting. [4] Implementing Regulation (EU) 2025/2620 supplies the calculation rules for the adjustment associated with EU ETS free allocation. [5] Implementing Regulation (EU) 2025/2621 establishes default emissions values, with Annexes I and IV replaced by Implementing Regulation (EU) 2026/1740, applicable from January 1, 2026. [6, 7] Verification and accreditation are addressed in Implementing Regulation (EU) 2025/2546 and Delegated Regulation (EU) 2025/2551. [11, 12]
Each serves a distinct legal function. A numerical default from the emissions annex cannot replace a free-allocation benchmark, and an EU ETS benchmark published for domestic allocation cannot automatically replace the benchmark designated by the CBAM calculation rules. A second timeline concerns proposed law. On December 17, 2025, the European Commission proposed extending CBAM to downstream goods and strengthening measures against circumvention. [13] The Council adopted its general approach on June 12, 2026, and the European Parliament adopted amendments on September 15, 2026. [14, 15] These three institutional texts represent distinct legislative positions. The proposed rules on product scope, material treatment, default-value safeguards, scrap, accreditation and emergency responses would create binding CBAM obligations according to the provisions and application dates of any legislation ultimately adopted. The three texts are examined as alternative legal scenarios that could influence prospective commercial decisions. Trade exposure is measured at several levels. A CN8 code identifies a customs population, but legal ex restrictions and importer exemptions can narrow that population. [2, 3, 13, 89] The emissions attributed to qualifying goods then enter the free-allocation and certificate calculations, while verification expense and contractual price transmission influence the eventual commercial burden. [4, 5, 6] The effect attributable specifically to CBAM requires a separate causal comparison with other market changes. The original submission’s separately maintained technical record defines the corresponding measurement objects and audit fields.
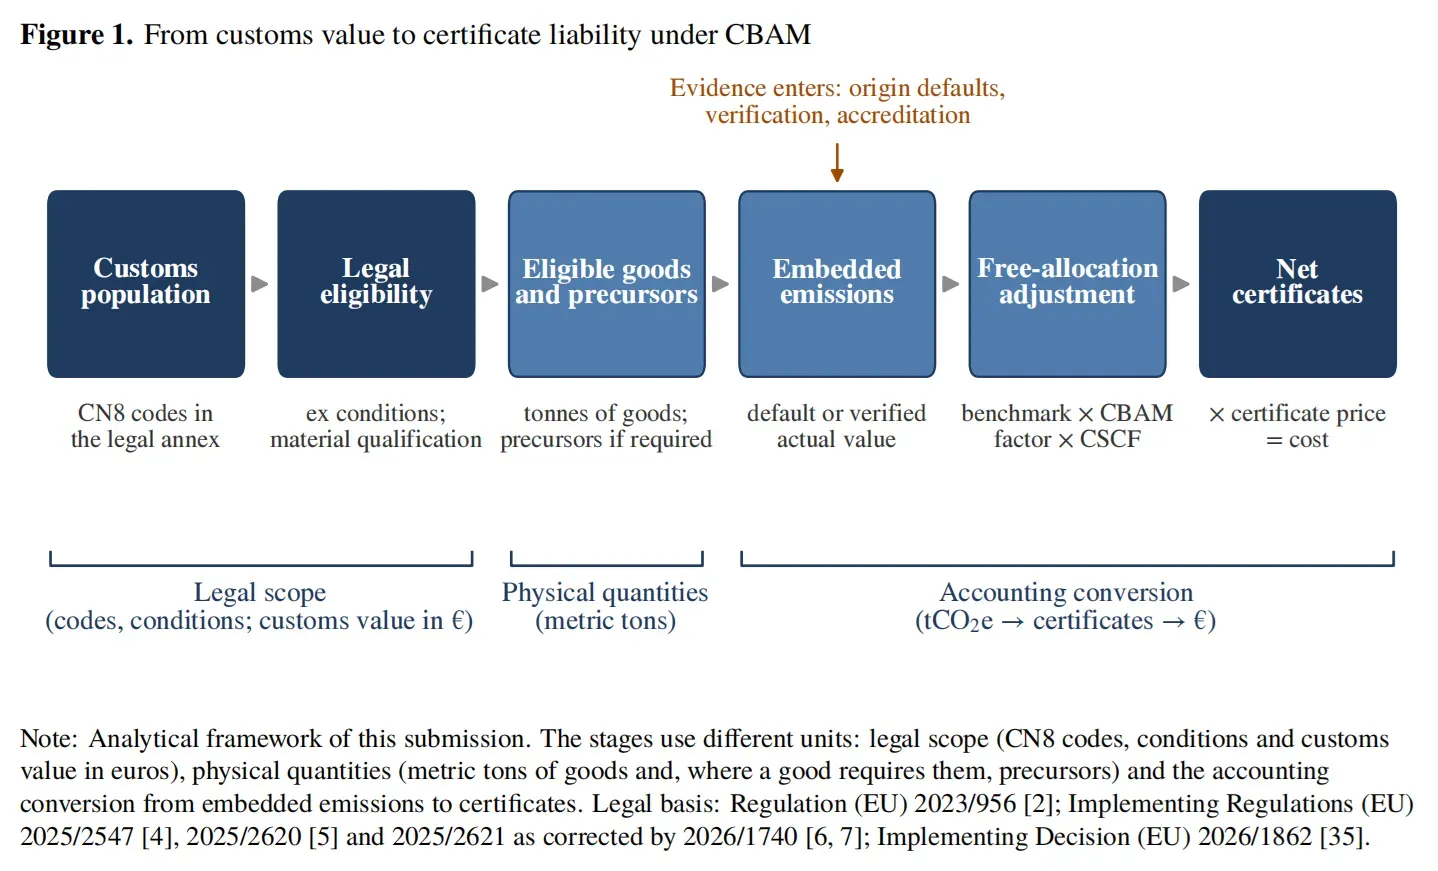
For example, an identical product made at two plants may face different default or verified-emissions outcomes even where EU demand is unchanged. Likewise, a lower default value for one exporting country affects the modeled certificate cost, although the producer’s delivered price also reflects freight, fuel, duties and contracts. [6] These comparisons retain the product, process, evidence route and legal year as separate variables rather than reporting a single national CBAM cost. [4, 5, 7]
2. Data Architecture, Customs Units and Reproducible Statistical Boundaries
The statistical foundation is Eurostat’s Comext detailed merchandise-trade dataset, DS-045409. [8] This research uses European Union 27-member-state imports from the United States, selecting reporter=EU27_2020, partner=US and import flow flow=1, with eight-digit Combined Nomenclature (CN8) product classifications. The principal indicators are VALUE_IN_EUROS, the reported customs trade value in euros, and QUANTITY_IN_100KG, the reported mass in units of one hundred kilograms. Physical mass in metric tons is obtained by multiplying the latter indicator by 0.1. A euro value per metric ton is computed only after confirming that the denominator represents a valid, comparable quantity observation. Eurostat import values are not identical to U.S. export values reported on a free-on-board basis, and they do not measure the U.S. value added embedded in foreign-assembled products. [53, 56, 78]
For each observation, the research matches the statistical commodity code to the legally applicable CN classification, then determines membership in one of four customs-scope scenarios. S0 represents current CBAM, S1 the Commission proposal, S2 the Council general approach and S3 the Parliament amendments. [2, 3, 13, 14, 15] The membership test concerns legally valid codes in the 2026 CN schedule, rather than merely matching the apparent digit length of a line in a proposal. Conditions such as ex, which limits a customs heading to a specified subset, and additional TARIC distinctions require a second eligibility test. Consequently the value of all shipments assigned to a listed CN8 code is a useful nominal full-code exposure; it is not automatically the value of goods that satisfy a narrower legal description. CN revisions affect both historical trade comparisons and proposed legal coverage. Where the 2025 entry 7308 20 00 divides into 2026 codes 7308 20 10 and 7308 20 90, the shared parent provides the valid bridge when the relevant legal scope covers the entire parent. [36, 37, 38] The power-conversion codes 8504 40 85 and 8504 40 86 instead have many-to-many relationships with their 2026 descendants; the appropriate method retains the common parent for a broad heading and marks narrower allocations as indeterminate until a concordance identifies the qualifying component. [14, 15, 36, 37] The historical audit covers 14 obsolete codes and 29 mapped relationships. [8, 36, 37, 38]
The Comext archive supplies full-year 2024 and 2025 totals and monthly observations for January through August 2026, including a separately recorded May extraction. [8, 9] Like-period year-over-year comparisons use the same eight calendar months, a consistent CN vintage and the same selection criteria. The annual and eight-month figures retain their observed reporting windows; later missing records are treated as missing data. The goods classification, statutory product description and observation year determine inclusion in each proposal scenario. Emissions calculations then use the corresponding production route, precursor boundary, legal reporting method and year-specific benchmark. [4, 5, 6] The method also prevents double counting where a Eurostat EU27 aggregate and its 27 national components appear in the same extraction. [8]
The 2025 hydrogen observation under CN 2804 10 00 records approximately 57,152 metric tons against €3.68 million in U.S.-origin EU imports, implying roughly €64 per metric ton. [8] The quantity is concentrated in a Netherlands entry in August, compared with about 31 metric tons for the full year 2024. [8, 9]
Because CBAM certificates scale with product mass, the model keeps the published observation in the customs series and reports parallel economic sensitivity calculations with and without its weight. The resulting certificate difference, described in Chapter 4, is directly attributable to the single flagged commodity record. The 2024–2025 trade comparison precedes the definitive CBAM period and measures historical values, quantities and composition under each customs scope. To estimate an additional CBAM-induced change in 2026, a comparison would match import months, goods and supplier origins while accounting for prices, freight, duties and seasonal patterns. The ammonia case uses the legal default-cost gap [5, 6, 7] to specify a causal hypothesis and separately examines observed shipments [8, 9, 18], maintaining the distinction between measured trade changes and their attributed causes.
The distinction between economic policy options and institutional legal texts
Two separate scenario families are maintained throughout this study. Option 1, Option 2 and Option 3 describe increasingly broad screening alternatives in the Commission’s December 2025 impact assessment. [81, 85] They were defined by the statistical and technical screening exercise discussed in SWD(2025) 988. S0, S1, S2 and S3, by contrast, identify the existing CBAM law and the subsequent proposed legal texts of the Commission, Council and Parliament. [2, 13, 14, 15] A legislative proposal may express a preferred policy option, but a later Parliament or Council code set must be measured against its own legal annex. The same numeral or nominal customs value does not establish identity of the two sets. This distinction allows a two-stage bridge. First, the 2025 and 2026 legal Combined Nomenclature editions are reconciled and a 2024 or 2025 observed value is attached to each valid CN8 member. [8, 36, 37] Second, the corresponding ex restriction and any material-qualification requirement are applied. [13, 89] The first stage is an observed whole-code trade amount, while the second produces a potentially narrower legal population. These stages are kept separate because the entire value of a customs code can contain articles outside the proposed legal definition.
Legal vintages, quantity units and concordance uncertainty
A cross-year customs comparison requires two independently identified legal vintages. [38] The 2025 Combined Nomenclature (CN), the EU’s eight-digit classification for customs and statistical purposes, is established by Implementing Regulation (EU) 2024/2522, whereas Implementing Regulation (EU) 2025/1926 supplies the version applicable in 2026. The Spanish Tax Agency distributes the 2026 code structure and a correspondence file for revised codes. Together, these sources make it possible to test each proposed code conversion against a legal definition and an official correspondence record rather than matching descriptions by intuition. The correspondence file is a cross-check resource; its presence on an agency website does not establish that every many-to-many relation in the original provisional map has been independently resolved. [36, 37]
Eurostat’s international-trade methodology identifies the CN as the principal goods classification, built on the Harmonized System, and also explains that CN data can be converted to other economic classifications. [8, 53] Comext’s dedicated application programming interface (API), meaning a documented machine-readable way to request observations, requires dataset-specific filters and separates annual from monthly extraction. [9, 54, 55] An annual current-scope estimate is therefore reproduced using the legally correct year’s CN8 set, the relevant reporter and partner, import flow, value measure and weight measure. Reporter, partner, flow, annual period and CN vintage are held explicit in each reproduced total. An additional statistical boundary matters for the proposed downstream rules. CN8 identifies an imported product category; it does not reveal the shares of steel, aluminum, titanium, nickel-based alloy or other materials in each physical unit. [37] The material bill of a product and the share of eligible precursors must consequently be estimated from engineering data, production pathways and the final legal boundary. [13, 14, 15, 19, 20] For each code, the evidence record should retain four distinguishable fields: legal coverage, measured gross customs value, technically defensible material-content range and the subset of emissions entering a certificate calculation.
3. The Structure of Existing U.S. CBAM-Covered Trade
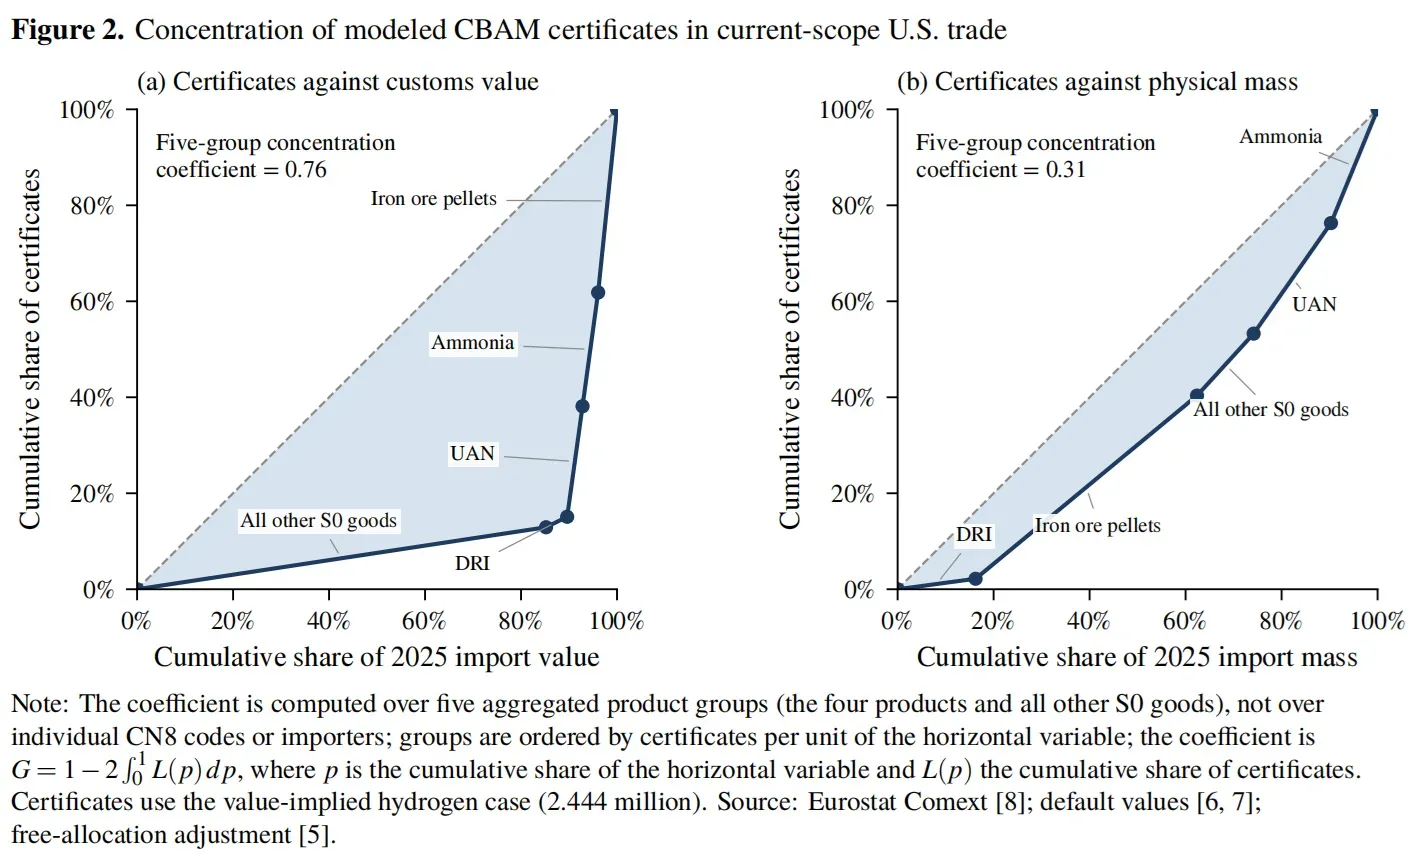
For current CBAM goods, the reconstructed 2024 EU27 import record from the United States totals €3.86 billion and 3.60 million metric tons. In 2025 the equivalent nominal full-code totals are €3.90 billion and 3.04 million metric tons. [8] Nominal merchandise value increased modestly while physical mass fell by approximately 15.5%. The divergent movements show why value and tonnage should be examined together, particularly in a scheme whose certificate obligation depends on emissions per unit of goods. The figures describe 2024 and 2025 historical trade inside the reconstructed current product scope; neither is an invoice for certificates purchased in 2026. Four commodity flows dominate the physical picture. In 2025, agglomerated iron ore pellets accounted for about 1.40 million metric tons with an import value of €153 million; direct reduced iron (DRI) accounted for 494,361 metric tons and €172 million; urea-ammonium nitrate solution (UAN) accounted for 490,506 metric tons and €125 million; and anhydrous ammonia accounted for 295,575 metric tons and €127 million. These four products jointly represent 2.69 million metric tons, or 88.2% of the reconstructed S0 mass, but only €577 million, or 14.8% of the value. [8] DRI is metallic iron made by reducing iron ore while keeping it largely in solid form. UAN is a liquid nitrogen fertilizer mixture. Their high physical mass creates a potentially important emissions-accounting exposure even when their customs value per metric ton is relatively modest.
| Current-scope product (2025) | Mass (metric tons) | Value (€ million) | Analytical relevance |
|---|---|---|---|
| Agglomerated iron ore pellets | 1,404,574 | 153.4 | High-volume upstream steel input |
| Direct reduced iron (DRI) | 494,361 | 171.6 | Process-sensitive metallic precursor |
| UAN solution | 490,506 | 124.9 | Multi-precursor fertilizer |
| Anhydrous ammonia | 295,575 | 126.8 | Origin-default and verified-route comparison |
| Four-product subtotal | 2,685,015 | 576.6 | 88.2% of mass; 14.8% of value |
The ranking by nominal customs value differs substantially from the ranking by mass. Higher-value steel and aluminum products can account for a large share of aggregate merchandise value without a comparable share of tonnage. [8] A third ranking, based on calculated net certificates, would differ again because it depends on the product’s embedded emissions, the route-specific default, the permitted actual values and the free-allocation adjustment. [4, 5, 6, 7] A trade-value chart identifies the commercial surface potentially affected by classification, a mass chart helps quantify the amount of material moving, and an obligation chart estimates certificate requirements under stated legal assumptions.
The exemption in Article 2a, introduced by the 2025 amendment, introduces a further distinction. [3] The initial threshold is 50 metric tons of cumulative annual net mass per importer for the specified massbased CBAM goods, calculated under the regulation’s coverage rules. [3] It is an importer-level annual test, not a threshold applied independently to each national industry, each CN8 code or each shipment. Importers that exceed the threshold become subject to the relevant annual obligations as provided by law. A national Comext total contains no information about the distribution of those metric tons across importing entities. The Commission’s September 2026 review found that the 50-metric ton threshold would exempt 0.87% of covered embedded emissions for the specified assessment interval, below the legal 1% ceiling. [30] That EU-wide estimate does not disclose the corresponding proportion specifically associated with U.S.-origin trade. There is also a distinction between product origin and corporate ownership. Eurostat’s partner field establishes a customs origin for the imported product. [8]
An American-owned firm may ship from an installation elsewhere, while U.S.-made material may pass through a Canadian or Mexican manufacturing chain and reach the EU as a product of another origin. Neither case can be reconstructed by assigning ownership from the U.S.-origin Comext record. The appropriate extension is a value-added and physical supply-chain analysis, using inter-country input-output accounts to examine industrial linkages and, where material identity matters, product and precursor records to identify eligible emissions. [26, 27] This issue becomes more important under downstream expansion because machining and assembly can change final-product origin while preserving the economic contribution of American upstream industry. The mass concentration in pellets and DRI makes their route-specific precursor and free-allocation treatment central to the certificate calculation. [4, 5, 6] The fertilizer chain requires recursive accounting for ammonia and related inputs, while prospective coverage of high-value metal goods depends heavily on material qualifications and precursor content. These analyses use different physical denominators: the first two concern production emissions per metric ton of commodity, whereas the downstream calculation begins by identifying the legally eligible metal inputs within a finished article. [13, 89]
U.S. steel production as an industrial denominator
Worldsteel’s 2025 statistical publication reports 79.5 million metric tons of U.S. crude-steel production in 2024, against 81.4 million metric tons in 2023. [67] The same statistical source separates oxygen-furnace and electric-route production and reports world steelmaking intensities for blast-furnace/basic-oxygenfurnace, DRI/EAF and scrap-EAF routes of approximately 2.32, 1.43 and 0.70 metric tons CO2 per metric ton of crude steel, respectively, using its 2023 methodology. [67] Those route averages concern the steel industry and its chosen accounting boundary; they cannot be substituted mechanically for a particular CBAM product’s legally defined embedded emissions. They nevertheless provide an independent technology-ordering check on a modeled comparison: a scenario that implicitly assigns the same energy process and emission intensity to scrap EAF and integrated coal-based steel warrants re-examination. U.S. production volume likewise establishes an industrial denominator for contextualizing specific EU import flows, without implying that all U.S. steel production is exported or eligible for CBAM.
4. From Embedded Emissions to Net CBAM Certificates
The statutory calculation can be understood as a chain of three quantities: emissions attributable to the relevant product, the corresponding free-allocation adjustment, and any legally creditable carbon price already paid in the country of origin. The first is measured in metric tons of CO₂equivalent per metric ton of product; the second adjusts the net certificate requirement in light of EU ETS allocation policy; and the third relates to the monetary cost of the remaining obligation under the evidence requirements in Article 9. The legal rules differ by commodity, production route, gas boundary and treatment of precursors. [4, 6] A compact equation therefore serves as a controlled illustration, with the implementing regulation determining how each input is
produced. [5]
For a homogeneous product under the selected 2026 default route, with no qualifying third-country carbonprice deduction, the illustrative quantity can be written as:
N_i,2026^(D0) = Q_i,2025 × max{0, D_base^(i,US) × (1 + m_i,2026) − F_2026 × CSCF_2026 × BM_i,route^(B)}
Here N is the modeled number of certificates; Q is observed imported product mass in metric tons [8]; D is the U.S. country-and-product default emissions intensity in tCO₂e per metric ton of product and m is the sectorand-year percentage mark-up [6, 7]; F is the CBAM factor for the year of import [39]; CSCF is the crosssectoral correction factor where applicable [35]; and BM is the production-route benchmark designated by the CBAM default calculation under Regulation 2025/2620 [5, 16]. The superscript D0 means the fully default-based calculation path. The 2025 subscript on mass and 2026 subscript on legal parameters explicitly identify a fixed-volume counterfactual, rather than a reported 2026 purchase or surrender of certificates. The maximum operator expresses the zero floor. Detailed recursive products and the interaction with Article 9 require the operative statutory method rather than a universal use of this simplified expression. [2, 4, 5]
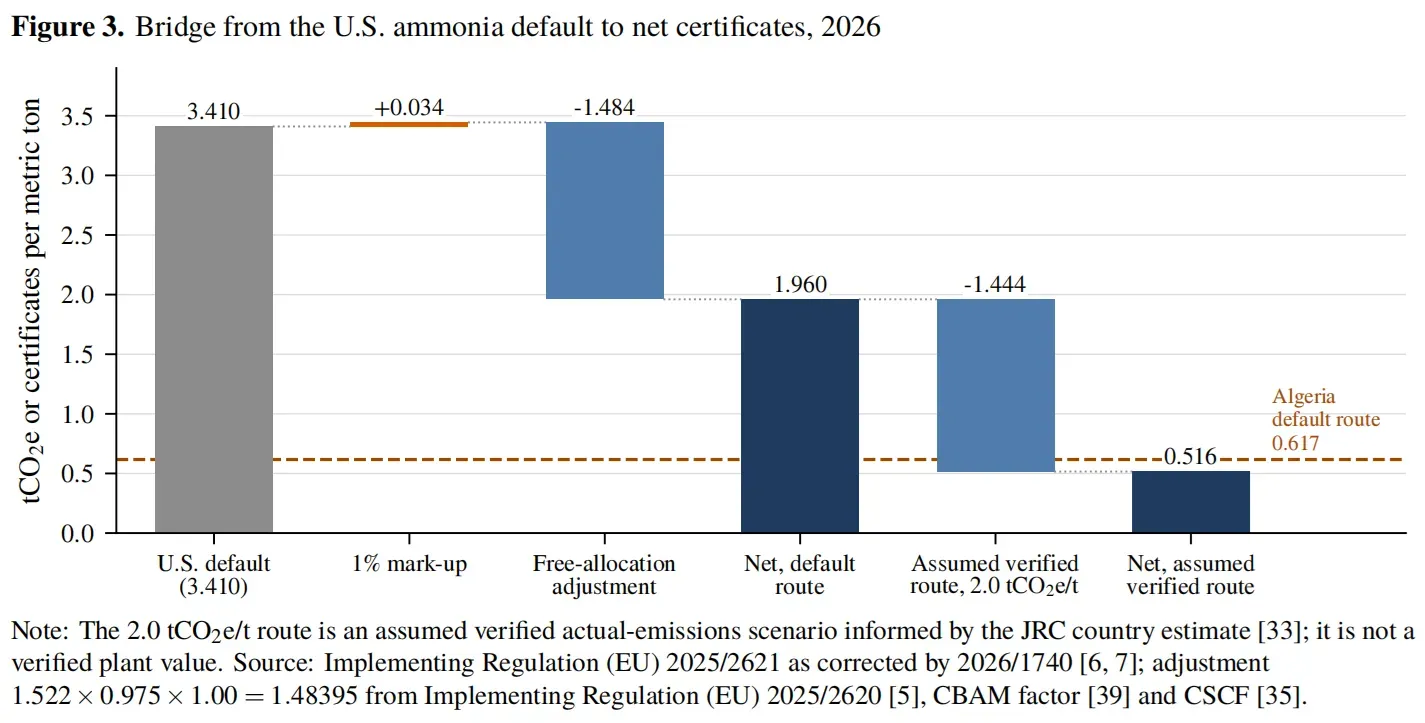
Regulation 2026/1740’s corrected Annex I directs that, for certificate calculation, base default total emissions be increased by 10% in 2026, 20% in 2027 and 30% from 2028 for cement, iron and steel, aluminum and hydrogen. [6, 7] Fertilizers carry a 1% mark-up from 2026. [6, 7] These rates are imposed on the applicable default; they are distinct from the CBAM factor that determines the phase-down of the free-allocation adjustment. For 2026 the factor used in the reproduced model is 0.975, reflecting the 2.5% initial phase-down. [39] Commission Implementing Decision (EU) 2026/1862 sets the uniform cross-sectoral correction factor at 100% for every year from 2026 through 2030, so CSCF is 1.00 in the verified calculation. [35] The model keeps these factors separate because their different legal functions generate different future trajectories. Anhydrous ammonia provides a transparent worked example. The official U.S. base default is 3.410 tCO₂e per metric ton of ammonia. Applying the 1% fertilizer mark-up yields 3.4441. [6, 7] The associated 2026 CBAM benchmark in the tested route is 1.522 tCO₂e/t, giving a free-allocation adjustment of 1.522 × 0.975 = 1.48395. [5, 16, 39]
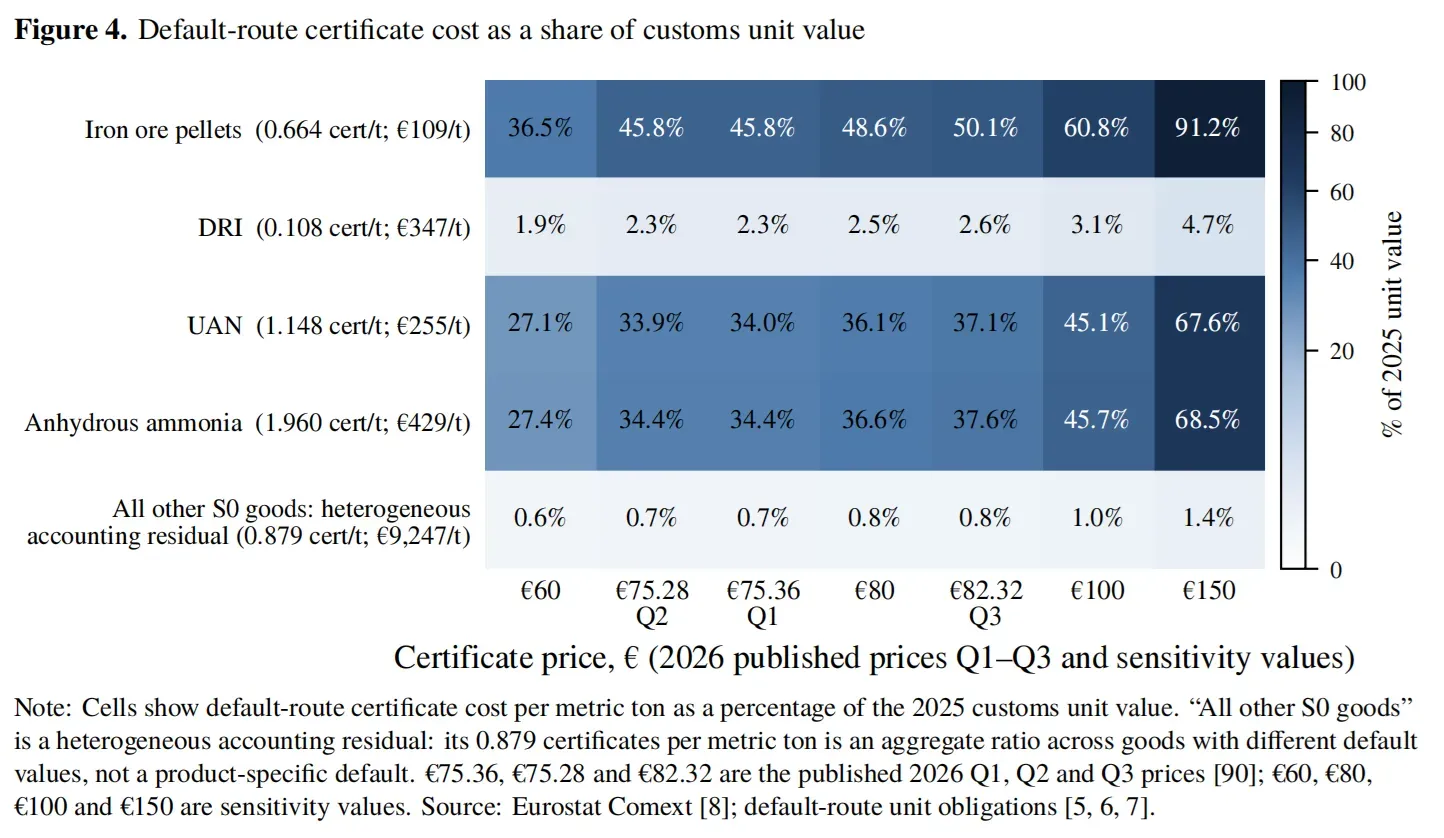
The resulting default-route net obligation is 1.96015 certificates per metric ton, approximately 1.96 in the main text. A parallel calculation for U.S. iron ore pellets begins with the base default 0.680, applies the 10% 2026 mark-up and deducts 0.086 × 0.975, producing 0.66415 certificates/t. [5, 6, 7, 16, 39] A comparable model result is approximately 1.15 certificates/t for UAN and 0.108 certificates/t for DRI, using their documented route assumptions [5, 6, 7]. The underlying full-precision parameters and precursor choices are documented in the technical materials accompanying the original USTR submission. Each unit number is a conditional legal pathway, not an average charge observed across American producers.
| Selected commodity | Reference trade period | 2026 modeled default-route net (certificates/t) | Status |
|---|---|---|---|
| Anhydrous ammonia | 2025 | 1.96015 | Direct default example |
| Agglomerated iron ore pellets | 2025 | 0.66415 | Direct default example |
| UAN solution | 2025 | approximately 1.15 | Route-specific model result |
| DRI | 2025 | approximately 0.108 | Route-specific model result |
Applying the specified unit rates to the four observed 2025 quantities yields approximately 2.13 million certificates under 2026 rules. [5, 6, 7, 8] At the published 2026 Q1 price of €75.36, the fixed-quantity scenario is worth approximately €160 million; the same obligation is valued at about €175 million using the published Q3 price. [90, 91] These values are price sensitivities for the same population, whereas each real quarter’s imports and eligible reductions determine its actual obligations. [5, 6] The legal calculation of complex goods requires additional care. In ammonia-derived fertilizers and steel products containing previously manufactured metallic inputs, embedded emissions may include the emis- sions of relevant precursors. [4] For an eligible precursor j, the model tracks the mass of precursor per metric ton of final product, its legally accepted emissions intensity and the corresponding free-allocation term. A simplified engineering identity is:
SEE_final = e_own + Σ_j (m_j × SEE_j)
where SEE is specific embedded emissions, e_own denotes the final production process’s eligible emissions, and mj is the metric tons of precursor j used per metric ton of final product. [4] Precursor production inside a jointly monitored installation and purchases from other plants require consistent system boundaries to prevent double counting. The legal calculation allows defined actual or default precursor values and multi-source averaging. [4, 6, 7] For default-derived precursors, two calculation orders for embedded free allocation are compared: adjusting the precursor’s eligible allocation at the precursor stage, or applying the relevant adjustment in the final product’s combined calculation. [5] Alternative boundaries for integrated steel processes are assessed on the same basis. The resulting declaration pathways can change the ranking between full-actual and mixed approaches. Where the production country of a precursor cannot be identified, Regulation 2025/2621, as amended by 2026/1740, prescribes the applicable Annex IV default. [6, 7] That value must be selected by the precursor’s CN classification and accounted for through the correct legal pathway. The EU ETS benchmark values established by Regulation 2026/1412 provide a separate EU-side comparison input; they do not replace the CBAM benchmark and adjustment system governed by Regulation 2025/2620. [5, 16]
The reported 2025 hydrogen weight generates approximately 1.39 million modeled certificates under the specified 2026 default route. [5, 6, 7, 8] The non-hydrogen population contributes 2.435 million; holding the 2024 hydrogen unit value fixed gives an alternative 2025 hydrogen weight of approximately 372 metric tons and a corresponding contribution of approximately 9,050 certificates, for a combined 2.444 million. Applying the reported 2025 hydrogen mass instead gives 3.827 million. The three cases isolate the effect of the unusual hydrogen mass observation while retaining a common legal calculation for other goods. [8, 9]
Reconciliation of selected products with the full current-scope calculation
The four-product estimate and the current-scope total reconcile as follows. Observed 2025 EU27 imports from the United States are multiplied by the corresponding 2026 default-route unit obligation for each relevant CN8 code. [5, 6, 7, 8] The four identified bulk products contribute 2.129 million certificates; other non-hydrogen covered goods add 0.307 million. [5, 6, 7, 8] Three hydrogen treatments provide the sensitivity comparison below. The detailed per-product table retains full numerical precision for checking the calculations.
Matched 2025 2026 model certificates product CN8 Observed metric tons per metric ton Modeled certificates Anhydrous 28141000 295,574.689 1.960150 579,370.727 ammonia Agglomerated 26011200 1,404,573.741 0.664150 932,847.650 iron ore UAN solution 31028000 490,505.794 1.148025 563,112.914 Directly reduced 72031000 494,361.019 0.107925 53,353.913 iron, lumps/pellets Four-product 2,128,685.204 subtotal
The remaining covered products contribute approximately 306,649 certificates, bringing the non-hydrogen total to 2,435,334. [5, 6, 7, 8] The published hydrogen weight adds 1,391,212 certificates, giving 3,826,546 in the reported-weight case. [8, 9] These calculations use the same legal parameters and unit-rate assumptions, so differences arise from product coverage and hydrogen mass treatment.
| Calculation stage | Modeled certificates | Additional certificates | Reference population |
|---|---|---|---|
| Four selected products | 2,128,685.204 | — | 2025 import quantities of the four products |
| Other covered goods, excluding hydrogen | 306,648.789 | 306,648.789 | Other current-scope CN8 goods |
| All observed goods except hydrogen | 2,435,333.993 | — | Non-hydrogen baseline |
| Hydrogen at 2024-unit-value implied mass | 9,051.187 | 9,051.187 | 2025 trade value ÷ 2024 unit value |
| Current scope, value-implied hydrogen | 2,444,385.180 | — | Conditional alternative-weight case |
| Hydrogen at reported 2025 mass, CN 28041000 | 1,391,212.296 | 1,391,212.296 | 57,152.224 reported metric tons |
| Current scope, reported hydrogen mass | 3,826,546.289 | — | Original reported-weight case |
For hydrogen code 28041000, the 2024 import observation records 30.967 metric tons and €306,119, equivalent to about €9,885/t. [8] Applying that unit value to the €3,675,669 reported in 2025 yields an estimated 371.8 metric tons and 9,051 certificates under the same modeled intensity. The 2025 customs observation itself reports 57,152.224 metric tons, worth approximately €64/t, yielding 1.391 million certificates. [8, 9] The value-implied figure is a price-stability counterfactual based on a small previous-year quantity; the reported-weight case retains the published 2025 statistical record. The non-hydrogen baseline is approximately 2.435 million certificates. [5, 6, 7, 8] At the official Q1 price of €75.36, the corresponding illustrative costs are €183.53 million excluding hydrogen, €184.21 million with value-implied hydrogen and €288.37 million under the reported hydrogen mass. [5, 6, 7, 8, 90, 91] The fourproduct subset alone represents approximately €160.42 million at the same price. Quarter-specific liabilities follow the applicable goods and reporting period.
Sensitivity to published 2026 quarterly certificate prices
The European Commission published 2026 CBAM certificate prices of €75.36 for Q1 (7 April), €75.28 for Q2 (6 July) and €82.32 for Q3 (5 October). [43, 90] The Commission’s price publication is the authoritative price-setting record; the Irish Environmental Protection Agency independently reports the same three published amounts and dates. [91] Prices for 2026 imports are quarter-specific, while the first purchases occur in 2027 under the statutory calendar. The following comparison deliberately holds the 2,128,685.204 modeled certificates from the four selected 2025 goods flows constant; it varies only the price. It therefore measures the price sensitivity of a single historical-quantity scenario, not what any importer actually owes for Q1, Q2 or Q3 of 2026.
Fixed-volume illustrative gross cost (€ Published 2026 quarter Certificate price (€/tCO2e) million) Q1 75.36 160.418 Q2 75.28 160.247 Q3 82.32 175.233
At fixed quantities and unit rates, the published Q3 price raises the four-product illustrative cost by approximately €14.8 million relative to Q1. [90, 91] Each quarter’s actual obligation is calculated from the corresponding imported goods, production evidence and legally eligible adjustments. [4, 5]
Relationship between the CBAM calculation and the EU ETS
The European Union Emissions Trading System (EU ETS) is established by Directive 2003/87/EC. [39] Article 10a provides the legal basis for harmonized free allocation, while Delegated Regulation (EU) 2019/331 specifies how eligible EU installations and sub-installations are separated for allocation accounting. [39, 40, 76] The 2026–2030 values in Implementing Regulation (EU) 2026/1412 and the national implementation measures referred to by Decision (EU) 2026/1312 must be understood within that EU ETS system. [16, 80]
A CBAM importer, however, obtains the applicable free-allocation adjustment through the separate rules of Implementing Regulation (EU) 2025/2620. [5] A numerical coincidence between an EU ETS product benchmark and an illustrative CBAM input would not justify substituting one instrument for the other. The present model maintains distinct columns for EU ETS comparator parameters and the CBAM certificate adjustment actually applicable to imported goods. The price of a certificate is a separate dimension of the obligation. Commission Implementing Regulation (EU) 2025/2548 governs calculation and publication of the CBAM certificate price and specifies quarterly price publication for 2026. [43] The product- and origin-specific certificate count is a quantity in metric tons of carbon-dioxide equivalent (tCO₂e); multiplying that count by an applicable price gives a monetary scenario. For example, a net obligation of 1.5 certificates per metric ton of product corresponds to €120 per metric ton at an assumed price of €80 per certificate. The illustrative €80 is an explicit scenario assumption, separate from the already published 2026 Q1–Q3 CBAM certificate prices and from any particular installation’s eventual payment. [90, 91]
This separation makes it possible to study what would change because of emissions intensity and what would change because of the common carbon-price variable. The accounting standard also has a procedural pedigree. EU ETS Implementing Regulation 2018/2066 sets out monitoring and reporting principles, including completeness, consistency and transparency, and Implementing Regulation 2018/2067 governs verification and verifier accreditation in that regime. [41, 42] The definitive CBAM calculation and verification instruments are related but legally distinct. [4, 11, 12] Reconciliation requires checking process boundaries, gases, input data, materiality and verifier scope in the CBAM texts, rather than treating an EPA emissions-reporting record or an EU ETS report as an automatic CBAM declaration. A correctly designed converter may use those public systems to supply evidence and calibration parameters while applying the CBAM definitions at the last stage. [4]
5. Production Pathways, Verified Actual Values and the Economic Value of Emissions Evidence
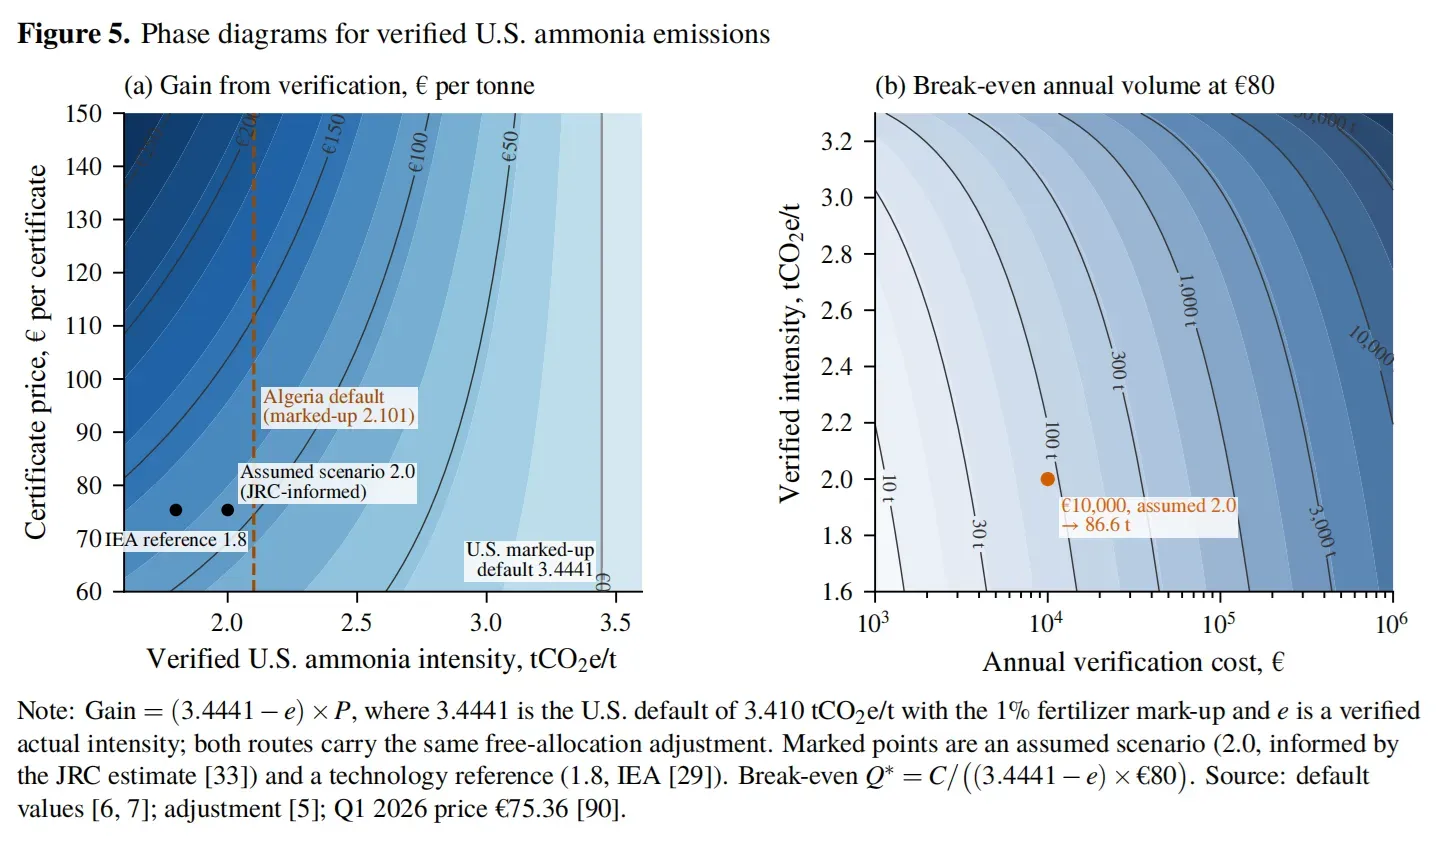
Industrial processes determine how much carbon can physically be emitted and where the relevant gases originate. CBAM law determines which of those emissions are counted, which can be represented by defaults and how a producer’s verified installation data enter the importer’s declaration. [4, 6, 11] The interaction matters because a low-emission installation can obtain a different legal result from its country default only when the eligible emissions boundary, production period, precursor data and verification conditions are satisfied. [4, 11, 12] Conversely, a default can sometimes produce a smaller calculated obligation than an accurately verified production route. The model must preserve both possibilities. For ammonia, the U.S. default-route net value of about 1.96 certificates per metric ton can be compared with a conditional actual-value case based on an approximately 2.00 tCO₂e/t U.S. process estimate used in the industrial process model [33]. Holding the same illustrative free-allocation treatment gives about 0.516 certificates/t, a difference of roughly 1.44 certificates/t from D0. These numbers identify an economically significant potential benefit from documenting lower production emissions. The 2.00 input is an illustrative approximation informed by a JRC country-level ammonia emissions estimate [33]. Facility-specific declarations depend on verified emissions and the applicable direct, indirect and precursor boundaries prescribed by EU law [4]. The distinction matters because the potential benefit can be calculated publicly even when no company’s private invoice is available. The technology range illustrates why a single country number cannot describe every ammonia plant. The International Energy Agency’s Ammonia Technology Roadmap reports best-available-technology reference intensities for several production pathways, including approximately 1.8 tCO2 /t for natural-gas steam methane reforming (SMR), 1.6 for autothermal reforming (ATR), 3.2 for coal gasification and substantially lower direct-emission values in certain carbon-capture or electrolysis configurations. [29]
SMR produces hydrogen by reacting natural gas with steam; ATR combines partial oxidation and steam reforming; carbon capture and storage (CCS) captures specified carbon emissions for permanent management. In a simplified illustrative comparison with the same 2026 benchmark, these reference intensities correspond to net certificate quantities of approximately 0.316, 0.116 and 1.716 per metric ton, respectively, before any additional legal accounting qualifications. The numerical spread is large enough to justify route-specific evidence and a meaningful verification-cost calculation. The fertilizer chain is more intricate. Ammonia is used in the production of urea and nitric acid, while am-
monium nitrate (AN) combines ammonia-derived chemistry with nitric-acid production; UAN is a mixture combining nitrogen-bearing constituents. [29] The recursive model assigns precursor masses and emissions to the final product rather than treating each commodity’s country default as a freely interchangeable emissions value. [4] The engineering assumptions include approximately 0.567 metric ton of ammonia per metric ton of urea and an AN pathway involving 0.2125 metric ton of ammonia and 0.7875 metric ton of nitric acid per metric ton of AN, subject to the specified production and allocation boundaries. These coefficients express material-flow assumptions and can be tested against chemistry and industrial process evidence. They are not proprietary manufacturer bills of materials. For urea, ammonium nitrate and UAN, the tested industrial-intensity range of ±30% gives lower net certificates under a fully actual-value declaration than under a fully default-based declaration when the precursor allocation is calculated at the precursor stage. [4, 5] Under an alternative ordering that carries the defaultprecursor adjustment into the final complex-good calculation, selected mixed declarations become favorable relative to fully actual declarations in later modeled years; the specified urea example crosses that ranking around 2030. [5, 6, 7]
The legal interpretation and precursor boundaries determine the relevant ranking, while projections after the current benchmark period remain conditional on the stated future parameters. The relative value of verified emissions for a hot-rolled steel product depends on the furnace charge and the adopted precursor boundary. [4] For the specified 2026 heading 7208 route-C case, the default calculation is approximately 0.204 certificates/t. [5, 6, 7] The illustrative scrap-based electric-arc-furnace case has total eligible actual emissions near 0.150 tCO₂e/t and approximately 0.0418 certificates/t after adjustment. The corresponding actual-emissions break-even intensities are approximately 0.3124 and 0.247 tCO₂e/t under two process-boundary treatments. The comparison applies to defined furnace and precursor assumptions and allows a plant-level calculation of whether verified emissions change the economic choice. [5, 7]
When 20% pig iron enters the modeled EAF charge, the emissions and eligible precursor accounting change together. [4] The modeled actual-value pathway gives approximately 0.5414 tCO₂e/t in embedded emissions and approximately 0.1886 net certificates/t after its modeled free-allocation adjustment. Other DRI/EAF and mixed-precursor branches can produce higher actual-path obligations than the relevant default. [5, 7] The sign of the verification advantage therefore depends on the furnace charge, production route, emissions evidence and treatment of the precursor’s associated adjustment. [6] A buyer’s technically plausible assumptions should be expressed as a range of physically feasible processes and legal branches, with the point at which the ranking reverses reported explicitly. Let ∆n denote default certificates per metric ton minus verified-actual certificates per metric ton, and P the applicable euro value per certificate. [5, 11] For a shipment of Q metric tons, the upper accounting benefit of adopting the alternative path under otherwise identical conditions is Q × ∆n × P. If the administrative, verification and coordination cost attributable to that shipment is C, the evidence investment has a positive direct certificate-related return when the eligible benefit exceeds C. This threshold analysis can be refined for repeated exports, facility-level fixed costs and risks of evidence rejection. It yields a concrete test of monitoring, reporting and verification (MRV) economics without needing to assert what an average U.S. producer actually paid. [4]
Public industrial data and constrained production routes
Industrial production creates several useful forms of public evidence that can be used without obtaining confidential factory accounts. Under the U.S. Environmental Protection Agency’s Greenhouse Gas Reporting Program (GHGRP), distinct subparts describe aluminum production (Subpart F), ammonia manufacturing (Subpart G), hydrogen production (Subpart P) and iron and steel production (Subpart Q). [57, 58, 59, 60, 61] The agency’s released datasets and technical-support documents specify observable process categories and accounting inputs; for instance, Subpart F describes primary aluminum electrolysis in Hall–Héroult cells, while Subpart Q separates integrated steelmaking, taconite processing and electric-arc-furnace operations. Such distinctions identify meaningful technology families and the physical boundaries of plausible emissions scenarios. They do not identify an individual export shipment’s CBAM emissions automatically, because the geographic, process and greenhouse-gas accounting boundaries can differ. The IEA’s Iron and Steel Technology Roadmap distinguishes blast-furnace/basic-oxygen-furnace steelmak- ing (BF–BOF), direct-reduced-iron/electric-arc-furnace production (DRI–EAF) and scrap-based electric-arc routes. [66]
Those are consequential differences in feedstock, reducing agents, energy carriers and installed assets. World Steel Association’s World Steel in Figures 2025 supplies observed industrial production and route shares, including the distinction between oxygen and electric steelmaking. [67] The U.S. Department of Energy’s Industrial Decarbonization Roadmap further documents why large sunk assets, energy infras- tructure and retrofit pathways constrain the speed at which production can change. [68] Used together, these sources support technology-specific counterfactuals and investment-time-horizon analysis rather than treat- ing every supplier as having immediate access to a representative low-carbon route. The public statistics have complementary roles. USGS reports trace iron ore, steel, aluminum and nitrogen- material supply and industrial flows [62, 63, 64, 65], while EPA reporting defines emissions source cate- gories. [57, 58, 59, 60, 61] Neither supply statistics nor reported emissions alone identifies a universal carbon intensity per commercial product. A defensible lower or upper engineering bound must make explicit the ore or scrap input, applicable process, energy and fuel use, product yield and eligible embedded-emissions boundary. The resulting range can be passed to the CBAM certificate model and compared with country defaults, which have their own legal sources. [6, 7]
If the sign of a competitive cost difference is unchanged throughout the range, further facility-level granularity may have little influence on that particular conclusion; if the sign changes, the sensitivity analysis identifies the inputs worth investigating. Hydrogen and ammonia supply an instructive example. The EPA defines ammonia manufacturing to include reforming of hydrocarbons and gasification of other feedstocks and separately defines hydrogen production by feedstock transformation. [58, 61] The IEA’s Ammonia Technology Roadmap and The Future of Hydrogen map the interaction of natural gas feedstock, synthesis chemistry, electrolysis and carbon capture. [29, 69]
On a mass-balance basis, the route used to generate hydrogen strongly affects the emissions attributable to subsequent ammonia production. [29, 69] Electricity prices and the grid mix alter electrolysis costs, while natural-gas prices and reformer efficiency affect fossil routes. These relationships can be modeled with observed regional electricity-price data and published technology envelopes; they do not require a hypothetical nationwide firm-average carbon-intensity assumption. Regional electricity prices add a separate, observable economic constraint to those technology envelopes. [70, 71]
Converting technology emissions estimates into the legally defined accounting boundary
An industrial engineering intensity and a CBAM actual-emissions intensity may share the same units while describing different process boundaries. [4, 33] The IEA’s ammonia technology comparison, for example, specifies production technology, fuel or feedstock inputs and treatment of captured carbon within its own analytical scope. [29] The CBAM value for a declared ammonia shipment is established under the relevant complex-good or simple-good rules, including the production process, direct and where applicable indirect emissions, precursor accounting and eligible verification method. The correct conversion is therefore a boundary concordance: identify every source included by the engineering study, classify it against the legally applicable CBAM category, then add or subtract only amounts for which there is an explicit physical and legal basis. [4, 6, 41]
The boundary comparison identifies the source gas, industrial process, combustion and feedstock carbon, purchased electricity, eligible precursors, carbon capture and allocation methods, together with the verification status of each contribution. [4] A lifecycle estimate that includes upstream methane or downstream distribution requires adjustment before use as a CBAM production-process intensity; combustion-only estimates may require legally attributable precursor emissions to be added. Reference intensities of 1.6 or 1.8 tCO2 /t remain conditional on a consistent product and legal accounting boundary. [4, 29, 41]
This distinction supports a concrete verification strategy. The first step is to calculate the size of the possible certificate saving using public route parameters; the second is to identify the subset of process records needed to convert the route estimate into an accepted actual value. [4, 11, 12] A facility with predictable feedstock use, metered energy and an established emissions-control system may have a comparatively short conversion path, while a plant with multiple precursors, co-production and imported electricity may require a more detailed reconciliation. [4] The difference follows from process topology and data relationships, not from the firm’s size alone.
6. Compliance Processes, Accreditation, Business Decisions and Cost Incidence
CBAM affects a sequence of business processes: installation monitoring, preparation of product and precursor evidence, verification, transfer of data to an authorized declarant, import customs administration and later certificate settlement. [4, 11, 12] A U.S. supplier may bear the cost of collecting its production information even though the EU declarant bears the statutory responsibility for the annual CBAM declaration and certificate surrender. [2] An importer may pay the immediate invoice but negotiate compensation through lower procurement prices. A supplier with low verified emissions may instead obtain a price or market-access advantage. Legal liability, contractual allocation and ultimate market incidence are different questions, each with an identifiable decision point. Importers and suppliers incur costs at different stages of CBAM compliance. Certificates represent the quantity-linked carbon charge, while metering, monitoring systems and accredited verification create installation-level expenditures. [10, 11, 12]
Customs filings, information exchange and document retention add administrative costs; working capital and warranties affect the financing and contractual allocation of those charges. Delayed entry or a sourcing substitution may impose an opportunity cost even when the eventual certificate quantity is small. The fixed annual portion of these activities becomes more expensive per metric ton as covered shipment volume declines, with the exact allocation governed by the facilities and contracts involved. The existing accreditation framework supplies a route for third-country verification. Under Implementing Regulation 2025/2546 and Delegated Regulation 2025/2551, eligible verification bodies established outside the EU can seek CBAM accreditation through an EU national accreditation body providing the relevant service. [11, 12] The European Commission’s operational timeline states that national accreditation bodies begin accreditation in 2026, accredited verifiers can enter the CBAM Registry from September 2026, verification work can begin, and the first verification reports may be issued from January 2027. [10]
These are implementation milestones, not evidence that every U.S. installation already has sufficient nearby capacity at an acceptable price. The publicly available institutional record nevertheless provides concrete examples of service entry. Accredia’s September 28, 2026 signed accreditation resolution records extensions of CBAM-relevant activity scopes for designated verification entities in Italy. [17] It permits assessment of which activity groups have actually been approved, rather than inferring all-sector capacity from a verifier’s brand name. The signed decision must govern any institution-by-institution scope list where a later explanatory news article differs. The European co-operation for Accreditation’s document EA-6/05 INF also provides a cooperative framework for foreign and local national accreditation bodies in third countries. [28] Such arrangements can make verification access operationally more predictable while retaining the legally required accreditation conditions. The Commission, Council and Parliament proposals introduce a separate prospective institutional path: agreements under an amended Article 2(12) concerning mutual recognition of third-country accreditation bodies. [2, 13, 14, 15]
The current Article 2(12) concerns carbon-pricing-related agreements in connection with Article 9; the proposed enlargement would allow recognition arrangements concerning accreditation for CBAM verification under Article 18. The Council specifically describes equivalence, impartiality and standards no lower than CBAM’s applicable rules. A future agreement-based recognition system would operate at the level of accreditation institutions; the present ability of an individual third-country verifier to apply to an EU national body operates through a different authorization route. These mechanisms should be designed to work alongside one another. A useful compliance analysis asks which facility data must be recorded, who can verify them, whether the verifier has the right sector scope, how a report is transferred into the declaration, what is retained for later inspection and how a challenge to a rejection can be resolved. [10, 11] The answers vary across a relatively simple homogeneous product and a complex downstream machine incorporating multiple external precursors. For a smaller U.S. producer, predictable templates and recognized verifier services may matter as much as the nominal certificate price. [12, 17]
For a large integrated producer, shared monitoring across several product families and repeated shipments can spread the fixed element over greater tonnage. Both are economically meaningful consequences of the existing regulatory architecture. Expected 2027 certificate costs already enter 2026 contracting decisions. EU importers may request process emissions data, seek contractual compensation for anticipated costs or substitute sources. A U.S. exporter with favorable verified emissions may offer evidence to preserve a landed-cost advantage. The resulting market response depends on product-specific contracts, available suppliers, freight and the EU importer’s position under the annual 50-metric-ton threshold. [3] Comext data identify the product, origin, value and quantity of imports, while importer-level obligations and employment consequences follow from different accounting populations. [8, 9]
Administrative architecture and the scale economics of evidence
The definitive-period compliance process contains identifiable legal and institutional steps. Implementing Regulation (EU) 2025/486 and its subsequent amendment 2025/2549 address the status of authorized CBAM declarants, while Implementing Regulation 2025/2619 addresses information supplied by customs authorities. Separate verification legislation and the Commission’s August 2026 verification guidance specify the role and accreditation of independent verifiers. The Commission’s October 2026 questions-and-answers edition supplies administrative interpretation, while the legal rules govern wherever the two differ. The importer therefore experiences a sequence of authorization, customs data matching, receipt of producer information, verification when actual values are used, price exposure and annual declaration. The fixed cost of organizing that sequence is analytically distinct from the per-metric ton certificate obligation. [10, 11, 12] The underlying authorization and customs-data obligations follow separate implementing instruments. [44, 45, 46] The Commission maintains current verification and operator guidance, including the October 2026 questionsand-answers material. [74, 75, 77]
A useful public-data model separates a compliance program’s annual fixed expenditure, denoted (F), from a shipment- or production-linked variable cost (v) per metric ton. For an importer handling (Q) metric tons in a year, the average compliance expenditure per metric ton is (F/Q+v). With unchanged fixed requirements, doubling (Q) halves only the fixed-cost component. Small shipment volumes therefore bear higher unit fixed costs even at the same statutory emissions intensity and certificate price. The actual level of (F) varies by product complexity, verification arrangements and information systems, and should therefore be entered as a range supported by publicly documented compliance tasks and any available market-price observations. [11, 12] Formal accreditation decisions, such as the September 2026 Accredia decision, establish qualified scopes and provider availability rather than an assumed universal price for audits. [17, 28, 77]
Administrative-cost evidence from the Commission’s own industry survey
The Commission’s impact assessment provides a more informative public basis for compliance-cost sensitivity than a single assumed verification invoice. [81] In Section 6.2.5 it reports 130 survey responses concerning the existing CBAM compliance cost and 30 responses concerning a downstream extension. [81]
The assessment estimates recurring baseline compliance cost for companies between €76 million and €371 million annually, using approximately 18,000 importers and individual average estimates of €4,248 to €20,637. [81] These figures describe the Commission’s survey-based EU importer population, not a sample of U.S. manufacturing exporters.
For the three downstream policy options, the same assessment’s Table 6 estimates incremental annual importer compliance costs of €2–10 million, €8–43 million, and €9–48 million, respectively. [81] The corresponding one-time adjustment estimates are €7 million, €31 million, and €35 million. It describes a 24%–43% increase in expected per-declaration complexity for downstream products and explicitly acknowledges that third-country producer data transfer is necessary but not fully quantifiable in its exercise. [81]
This is a substantive finding for U.S. engagement: upstream data generation, supplier documentation and EU import declarations can impose costs on different legal actors within the same transaction, and an importer’s questionnaire does not necessarily measure the full chain. The physical shipment quantity and the number of declarations are distinct denominators. If the cost of maintaining a reporting system is fixed at F euros per year, and V is compliant shipment volume in metric tons, then the unit fixed cost is F/V. If each declaration requires an additional marginal cost d euros and n declarations are filed, the total accounting service cost is F + nd. In a simplified price sensitivity, the supplier’s incentive to document actual emissions rather than use defaults increases with the expected certificate saving P × V × ∆q, where P is the certificate price and ∆q is the number of certificates avoided per metric ton by using admissible actual emissions. [4] The break-even condition is P × V × ∆q > F + nd + C_verify, after including the verifier cost C_verify relevant to that route. This inequality can be evaluated by scale and process without a representative private invoice. The Commission’s empirical cost ranges provide an external calibration envelope; their importer-specific definitions must remain attached to any use in a U.S. exporter scenario. [81]
7. Three Downstream Expansion Proposals: Scope, Substantive Rules and Implementation Problems
The three institutions’ downstream proposals differ in their customs coverage and in the rules that would determine how newly covered goods are assessed. A comparison confined to the number of customs headings would overlook the treatment of emissions evidence, scrap, precursor origin, importer thresholds and the intended exclusions for products made entirely from materials outside CBAM. The relevant documents are the Commission’s COM(2025) 989 proposal, the Council’s June 2026 general approach, ST 10423/26, and the Parliament’s September 2026 adopted amendments, P10_TA(2026)0276. [13, 14, 15] For the period examined, these are three legislative positions, not three concurrent binding regulations. The customs reconstruction applies each text to the valid 2026 CN8 classification. The operative S0 set contains 572 valid CN8 members. [2, 3, 37] The Commission’s S1 set contains 750, corresponding to 178 additional members relative to the S0 set. [13] The Council’s S2 set contains 945, or 373 additional members. [14] The Parliament’s text yields 1,163 members when interpreted strictly, but 1,190 if its 8481 00 reference is taken to denote the entire valid 8481 valve heading. [15] These are the results of expanding a mixture of four-, six- and eight-digit legislative entries into valid eight-digit codes and applying the documented exclusions. A count of members is not the count of original legislative rows: one higher-level heading may expand into many legally valid CN8 descendants. [37]
| Scenario | Legislative status | Valid 2026 CN8 codes | Principal classification issue |
|---|---|---|---|
| S0 | Binding current scope | 572 | Existing ex and product restrictions |
| S1 | Commission proposal | 750 | Specific downstream steel and combined-metal goods |
| S2 | Council general approach | 945 | Machinery additions; supplementary notes and deletions |
| S3, strict | Parliament amendment, literal reading | 1,163 | Invalid 8481 00 reference; broader headings |
| S3, interpreted | Parliament amendment, possible heading-wide reading | 1,190 | Treating 8481 00 as heading 8481 adds 27 CN8 codes |
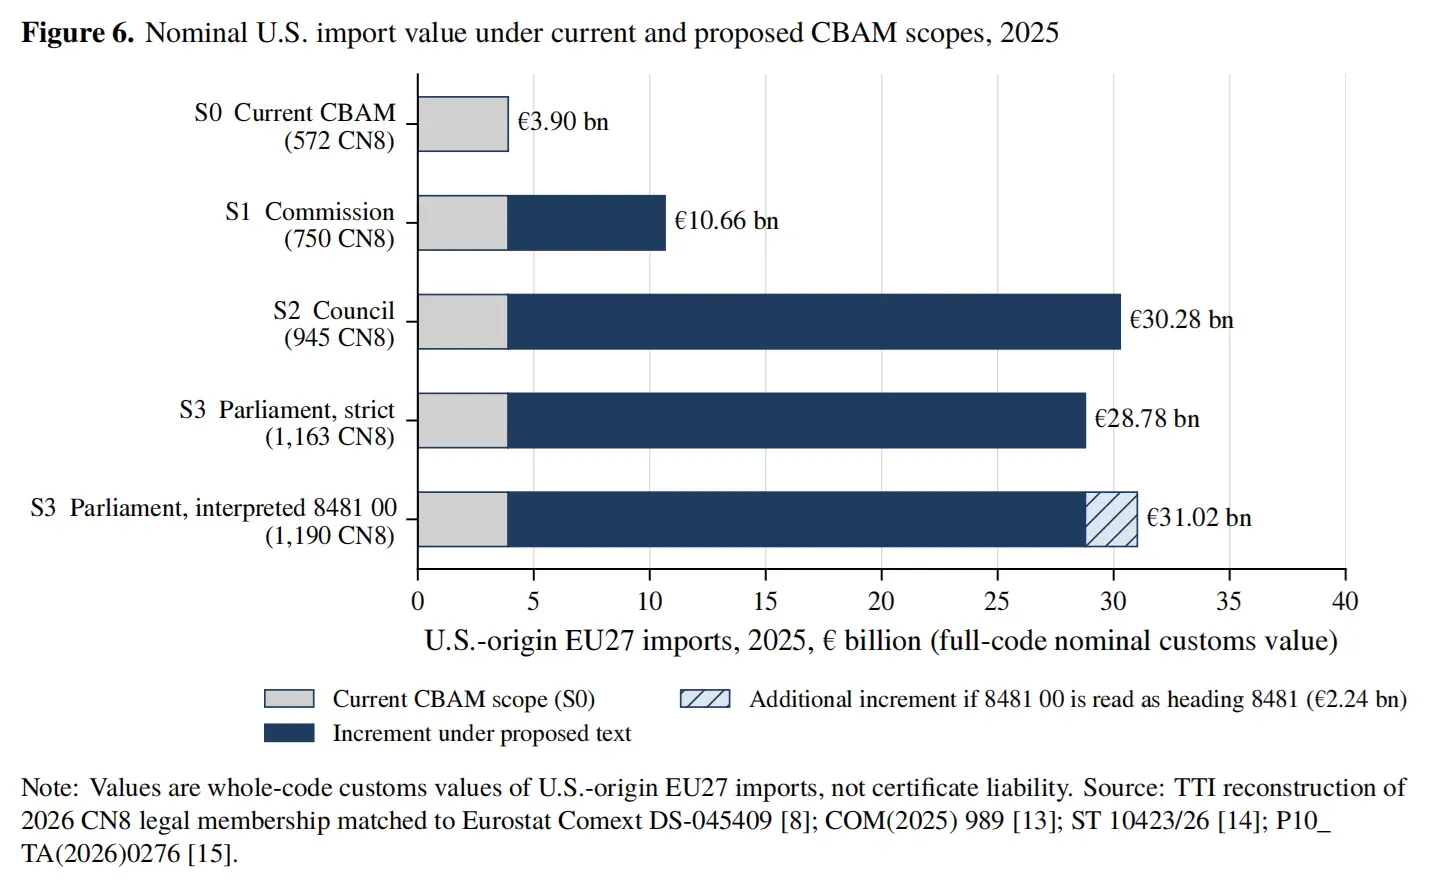
In the Commission proposal, the legal-code mapping identifies seven additional steel-related lines and 107 combined-metal-product lines, before conversion to the CN8 membership set. [13] The Council’s NOTE 1 adds two groups of detailed codes, while NOTE 2 deletes 9018 32 10, ex 9018 90 75 and ex 9018 90 84; the last is associated with approximately €3.40 billion in 2025 whole-code U.S. imports and represents about half of the Commission’s incremental S1 trade value. [8, 14] The six Council-listed CN8 entries associated with gas turbines and related equipment under heading 8411 warrant particular attention because of their exceptionally large historical merchandise value and complex material composition. [8, 14] The Parliament
broadens coverage through entire headings in Chapter 73 and additional machinery or transport-related positions, while some ex restrictions and gas columns require legal clarification. [15] These differences are retained in the original legal-entry records so that their economic implications can be recalculated following an eventual compromise. Substantive rules can alter treatment without changing an importer’s CN8 code. The Parliament’s proposed Article 6(7) establishes a framework for identifying combinations of goods and origin countries with a high risk of abusive practices, including forms of resource shuffling. [15] The risk assessment would draw on relevant features of a country’s production structure and climate policy, heterogeneity of emissions, export volumes and certain trade-remedy findings, among other elements specified in the adopted amendments. [15]
A designated combination could face additional evidentiary requirements when claiming actual emissions, with default values applying when the prescribed evidence conditions are not met. Under the proposed route, a qualifying operator would still be able to substantiate actual emissions through the relevant evidence process. A trade-remedy measure applicable to a U.S.-origin good is therefore an input into a possible assessment, rather than an automatic CBAM high-risk designation. [15]
The distinction matters for two existing products. Regulation (EU) 2026/65 maintains definitive antidumping duties on specified UAN mixtures under CN 3102 80 00, including U.S.-origin products. [21]
Regulation (EU) 2022/58 concerns trade-remedy treatment of grain-oriented electrical steel. [22] Their factual and legal relationship to a future high-risk criterion must be established at the product and measure level. [15] A sound implementation would state what evidence is relevant, what constitutes a material connection between a trade remedy and the alleged carbon-accounting abuse, how an exporter can demonstrate that its product came from the declared installation, and how a designation is reviewed. Predictability is especially important when the expected value of reporting actual emissions can exceed the margin on a shipment. Proposed provisions on scrap add another industrial dimension. Primary production, pre-consumer scrap created during manufacturing and post-consumer scrap recovered after use occupy different places in metal manufacturing and associated emissions accounting. The Parliament’s amendments alter several proposed steel and aluminum scrap entries, including the treatment of ex 7204 and 7602. [15] The correct comparison separates customs listing of scrap as a good, its possible treatment as a precursor in another good and the method for attributing emissions to that precursor. An amendment to an annex entry cannot be translated automatically into a universal emissions figure for scrap-fed production. Its consequences should instead be tested on steel and aluminum chains with known scrap fractions and processes. [13, 14]
The Parliament also proposes a five-metric ton mass threshold for designated aluminum products in its downstream annexes. [15] This is a proposed special threshold with its own object and coverage, whereas the enacted Article 2a threshold of 50 metric tons is based on cumulative annual imports by an importer under current specified sectors. [3] The effects on small suppliers cannot be evaluated by applying either threshold to a national trade total. The relevant question is whether the proposed rule changes which importers or product categories must undertake reporting and evidence preparation. A policy comparison needs the operative annex and commodity conditions alongside the importer-level threshold, not a single countrywide number. A further institutional question concerns carbon-price agreements, international credits and recognition of emissions evidence. Article 9 of the current regulation permits an eligible deduction for a carbon price effectively paid in a third country, subject to documentation and applicable conditions. [2] Existing Article 2(12) permits agreements connected with carbon pricing. The Commission, Council and Parliament proposals would add a route for mutual recognition of accreditation bodies from third countries that fulfill the requisite equivalence conditions. [13, 14, 15]
The Parliament’s proposed Article 9a also addresses agreements whose terms would directly or indirectly reduce or exempt CBAM obligations. [15] These provisions need coordinated drafting: a lawful Article 9 deduction and an accreditation agreement serve different legal functions, and recognizing a verifier’s accreditation system does not itself change the quantity of emissions or automatically waive certificate surrender. The proposals contain different mechanisms for responding to exceptional market circumstances and risks of circumvention. [13, 14, 15] Some are directed at urgent market or supply disruptions, while others address practices designed to avoid the carbon cost, including redirection of lower-emission production without a broader reduction in emissions. Their authorities, trigger tests, duration and review should be assessed clause by clause. In particular, implementation must distinguish an emergency exemption for a limited product or region from a broadly available reporting method. A temporary adjustment with narrow conditions produces very different commercial expectations from a permanent exclusion of an entire equipment heading. A legal stress test of the Council approach is provided by Recital 43. [14]
It identifies the possibility that a downstream product can be made entirely from materials outside CBAM and envisages excluding such a product from Annex I coverage. Recital 42 limits the intended downstream emissions attribution to relevant input materials, and Recital 44 addresses the difficulty of obtaining actual precursor emissions across complex supply chains. These recitals identify an operational design problem: an importer needs a legally effective test for establishing whether a finished product’s component materials belong to the covered set. A recital can guide interpretation, but an enforceable criterion, documentary pathway and review mechanism should appear in the operative framework. Taken together, the proposed scope and rule changes point toward a concrete legislative task. The EU institutions can agree upon valid CN references, coherent ex limitations, defined material-qualification rules, reviewable origin-risk classifications, a workable relationship between actual and default evidence, clear scrap accounting and consistent institutional recognition of verifiers. [13, 14, 15] Each improvement affects a different stage of the importer’s compliance process. This is the appropriate level at which to assess potential downstream impacts on U.S. machinery, steel, aluminum and fertilizer trade before a final regulation exists.
What the Commission’s impact assessment does, and what the institutional proposal comparison adds
The Commission evaluated three economic-policy options before choosing its proposal. [81] The Council and Parliament texts are subsequent legislative positions, not alternative names for those options. [14, 15]
A crosswalk is therefore required before the impact assessment can be used as a comparator for S1, S2 or S3. [81] In particular, the Commission’s preferred downstream Option 2 was chosen following a comparison of environmental coverage, carbon leakage risk and compliance costs, while the Council’s additional 8411 entries represent a distinct scope alteration. [82]
| Object | Period and population | Nominal value or reported exposure | Interpretation |
|---|---|---|---|
| Commission impact assessment Option 1 | 2024 U.S. exports to EU; Option 1 products | Approximately €1 billion | Baseline policy-option exposure |
| Commission impact assessment Option 2 | 2024; wider option list | Approximately €6 billion | Preferred option in impact assessment |
| Commission impact assessment Option 3 | 2024; broadest option list | Approximately €10 billion | Broad option exposure |
| S1 Commission legal proposal | 2025 EU imports from U.S. under the proposed code list | Approximately €10.7 billion | Whole-code, not eligibility-adjusted |
| S2 Council legal text | 2025 EU imports, Council code list | Approximately €30.3 billion | Includes large 8411 code universe |
| S3 Parliament strict | 2025 EU imports, strict valid code list | Approximately €28.8 billion | Excludes unsupported repair of 8481 00 |
The first three values come from Section 6.2.3.2 and footnote 69 of the Commission assessment [81]; the other three use Comext observations and the legal-code mapping. [8, 13, 14, 15] The different years and product populations preclude a direct ratio as an estimate of policy impact. A proper comparison would recompute each exact code population for both years, identify scope terms that select only part of a heading and reconcile the material qualification rules. In the absence of that concordance, the correct analytical result is two well-defined sets of observations with a documented population mismatch. The Commission used its JRC-GEM-E3 modeling framework to estimate changes in downstream-sector imports relative to a future no-extension baseline. By 2035, its three policy options imply aggregate EU downstream imports 0.08%, 0.29% and 0.35% below baseline. [81] Its reported downstream-sector employment changes for 2030 are +0.01%, +0.05% and +0.06%, respectively, with sector differences shown in Table 5. [81] These results concern EU-wide industry aggregates and should be compared to U.S. industry exposures only after a matching country-and-sector bridge. They establish that the Commission has quantified some EU-wide macroeconomic incidence. They do not, by themselves, identify the American value added embodied in imports of finished equipment produced through Canada or Mexico, a U.S. exporter-specific compliance cost, or the qualifying steel and aluminum material content of the amended turbine and valve code populations. These are precisely the areas where country and material tracing can add decision value beyond broad-sector averages.
Product-screening correspondence to the Commission impact assessment
The Commission’s impact-assessment Annex 4.2 documents screening of 1,560 PRODCOM 2023 product categories using observed production, imports and exports over 2016–2023, a trade-intensity measure, the expected carbon-cost push on downstream producers, and a minimum EU production-emissions filter. [81, 85, 88] The three options use different selection thresholds, while the trade-intensity and cost-push combination requires the stated frontier rather than a mechanical rule that independently tests two thresholds. The published annex summarises resulting CN-code populations of approximately 70–80, 150–180 and 230–250 for Options 1, 2 and 3, respectively. [81, 85] The preferred Commission legislative proposal, after reconstruction in valid CN2026 members, adds 178 CN8 codes to S0. [37, 89] Its numerical consistency with the
Option 2 range is useful but does not establish identity of the underlying PRODCOM product memberships. The Commission’s impact assessment establishes the original three policy-option screens and aggregate results. [81, 85] The subsequently proposed legal annex defines 178 additional CN8 members under Commission scenario S1; the trade calculations use that legal population and a material-eligibility fraction where an ex description limits coverage. [8, 13, 89] The contractor’s technical screening is documented in the Commission’s original impact-assessment evidence, while its specific policy-option populations remain distinct from the enumerated S1 legal text. [81, 85, 87, 88]
For the 2024 Commission S1 trade population, the whole-code nominal increase is €6.887 billion over S0, compared with the Commission’s approximately €6 billion of U.S.-origin relevant merchandise under its preferred impact-assessment option. [8, 13, 81] The values are in the same reference year, but still differ in production-code vintage, legal eligibility and potentially the set of goods represented. Different productscreen and qualification choices explain why the two totals need not coincide. [85] The material-eligibility distribution developed below explains why a whole-code customs figure can exceed a product-filtered exposure without any contradiction in the underlying source statistics.
8. Nominal Downstream Trade Exposure, Eligible Materials and the Value of Finished Goods
The proposed downstream rules create the largest legal-accounting uncertainty where a customs code contains finished goods with diverse material compositions. Trade in those entire CN8 codes supplies a nominal exposure envelope, while ex conditions, material eligibility and the applicable precursor treatment determine the narrower population that could generate certificates. [8, 13, 14, 15] Chapter 2 documents the code reconciliation, and the detailed scenario values appear in the preceding USTR response and the separately maintained technical record. The remaining issue is the relationship between the value of a complete imported article and the production materials that qualify under the proposed rule. The Council scenario is driven to an unusual degree by equipment in heading 8411. [14] Six identified CN8 entries associated with gas turbines, aircraft engines and related parts represent approximately €18.8 billion of U.S.-origin EU imports in 2025 in the S2 scope, including approximately €15.8 billion under 8411 91 00. [8, 14] This is a substantial quantity of high-value manufactured merchandise. Its full customs value includes precision engineering, machining, specialized materials, assembly, services embodied in production and other attributes of the finished good. The physical quantity of steel or aluminum inputs potentially relevant to a downstream CBAM precursor rule can be far smaller than either the entire engine mass or the invoice value. [19] The law must identify which inputs are within its material and production boundary before a credible certificate calculation becomes possible. [13, 14]
Published engineering evidence provides a physical constraint on the comparison. GE’s CF6 engine account identifies iron-based and aluminum-based material groups alongside nickel-based superalloys, titanium and other materials. [19] The related engineering record distinguishes material families, while product-specific qualifying metal fractions require further documentation. For a certificate calculation, the next questions concern which of those material families meet the operative steel or aluminum definition and how qualifying precursors were produced. Nickel-based superalloys, for example, require their own material classification rather than automatic assignment to the steel category. A simple sensitivity illustration makes the difference visible. Let M be the mass of a particular finished turbine assembly and s its potentially eligible CBAM precursor mass fraction, with 0 ≤ s ≤ 1. The mass of eligible material is then sM, before applying manufacturing yield, precursor history and the actual legal emission boundary. If a product weighs 1,000 kilograms, assumed fractions of 0%, 5% and 25% correspond to 0, 50 and 250 kilograms of potentially eligible material. These are sensitivity inputs, not claims about average turbines. A process-based emissions model must further determine which constituent metals qualify, their production routes and origins, and whether their embedded emissions are counted under the adopted downstream method. [4, 13, 14]
A high nominal value of machinery can coexist with a relatively modest eligible metal mass and a significant documentation burden. The Parliament’s 8481 00 reference is a different boundary problem. [15] It is not a complete valid CN8 code; interpreting it strictly or as a reference to the whole 8481 heading produces 27 additional valid CN8 members in the broader branch. [15, 37] The observed difference in 2025 nominal U.S.-origin trade is €2,243,508,013, or about €2.24 billion. [8, 15, 37] That is large enough to reverse the ordering between Council and Parliament nominal exposure totals. Published manufacturer material and weight tables for specific Emerson valve configurations provide a physical basis for later precursor analysis, but they cannot resolve which CN8 descendants the legislature intended. [20] Correcting the legal classification must precede any confident whole-heading cost estimate. [15, 37]
The distinction between materials and product value also runs through the small-business compliance problem. A manufacturer of a technically sophisticated valve may have a small quantity of steel and aluminum in a relatively costly finished product. [20] If the eventual law requires extensive documentation even for a near-zero certificate outcome, fixed compliance costs may be economically material. If the final regulation adopts an effective exclusion for goods made exclusively from materials outside scope, importers will need a clear evidentiary mechanism for establishing that condition. [13, 14, 15] These rules can improve market efficiency by reducing uncertainty about where accounting is required. The S2/S3 comparison restores supported 2025 parent-level observations for selected CN changes, including 7308 20 00. [8, 14, 15, 36, 37, 38]
Parliament’s broad proposed heading 8504 also includes 2025 power-conversion flows whose common parent is covered. Selective institutional scenarios retain a separately marked range for the many-to-many descendants that cannot be attributed uniquely from a historical parent. This treatment preserves the observed value while keeping the difference between a broad legal heading and a narrow successor code visible in the scenario totals. An importer’s downstream declaration depends on four determinations: whether the finished product’s valid customs classification appears in the adopted scope; whether any legal ex, material or importer exclusion applies; which eligible production materials or precursors carry embedded emissions; and what verified or default method converts those emissions into a net certificate obligation. [2, 4, 5, 13] The policy priority is to make all four determinations possible from publicly specified rules and reasonable product documentation. A full-code trade-value scenario is the beginning of that analysis, not a completed estimate of carbon liabilities for machinery.
Measured concentration of the Commission’s conditional downstream scope
A legally structured decomposition of the Commission’s incremental S1 codes makes the uncertainty measurable. [13, 89] For 2024, €2.238 billion falls under 136 full-code listings, €4.612 billion under 39 materialconditioned listings and €0.0365 billion under three other ex entries. The corresponding 2025 amounts are €2.001 billion, €4.732 billion and €0.0248 billion. [8] Thus most of the nominal merchandise exposure is attached to codes for which the trade record alone cannot determine whether the relevant consignment qualifies for the new rule. The correct exercise estimates or bounds the fraction of merchandise customs value satisfying each legal description, while separately calculating qualified steel/aluminum input mass and embedded emissions. One medical-instrument code, 9018 90 84, accounts for €3.226 billion of the 2024 whole-code value and €3.397 billion in 2025. [8, 89] Its share of the incremental proposal is 46.85% and 50.26%, respectively.
That concentration means the material-qualification rate of the medical-instrument population has far more influence on the headline customs-value estimate than the eligibility rate of many smaller categories combined. Item-level steel or aluminum content determines whether a medical instrument qualifies under the proposed ex entry; legally eligible precursor material and emissions determine its certificate calculation. A single product-specific customs and materials inquiry would therefore have unusually high information value. Under the Commission’s current proposed text, the listed ex code covers instruments and appliances containing steel or aluminium, without an expressly stated minimum material fraction for that entry. [13, 89]
An item-level eligibility condition should be resolved before estimating the fraction of whole-code customs trade within scope; a separate precursor and process test is needed before calculating embedded emissions. This provides a precise basis for a USTR request for an administrable material test, rather than an instruction to value every medical instrument as steel or aluminum. Define F_t as the annual value of full-code listings, H_t as whole-code value for the medical heading, O_t as whole-code value for all other conditionally listed entries, including the three other ex entries, and q_H, q_O as hypothetical fractions of whole-code customs value satisfying those legal entry descriptions. The eligibility-adjusted nominal merchandise value is
qualified Vt = Ft + qH Ht + qO Ot , 0 ≤ qH , qO ≤ 1.
For 2024 this becomes €2,237,845,328 + q_H × €3,226,107,795 + q_O × €1,422,705,417. [8, 13, 89]
It ranges from €2.238 billion to €6.887 billion across the full two-parameter unit square. With q_O=1, the equation equals €6.0 billion at q_H≈0.7252, purely as a mathematical exercise. This percentage is not an inferred medical-product eligibility rate or a recovery of the Commission’s private screening assumptions. Its purpose is to show the scale of legal-material qualification needed to reconcile differently defined aggregates. The qualification shares do not automatically equal mass shares or the fraction of the goods’ value subject to a carbon charge.
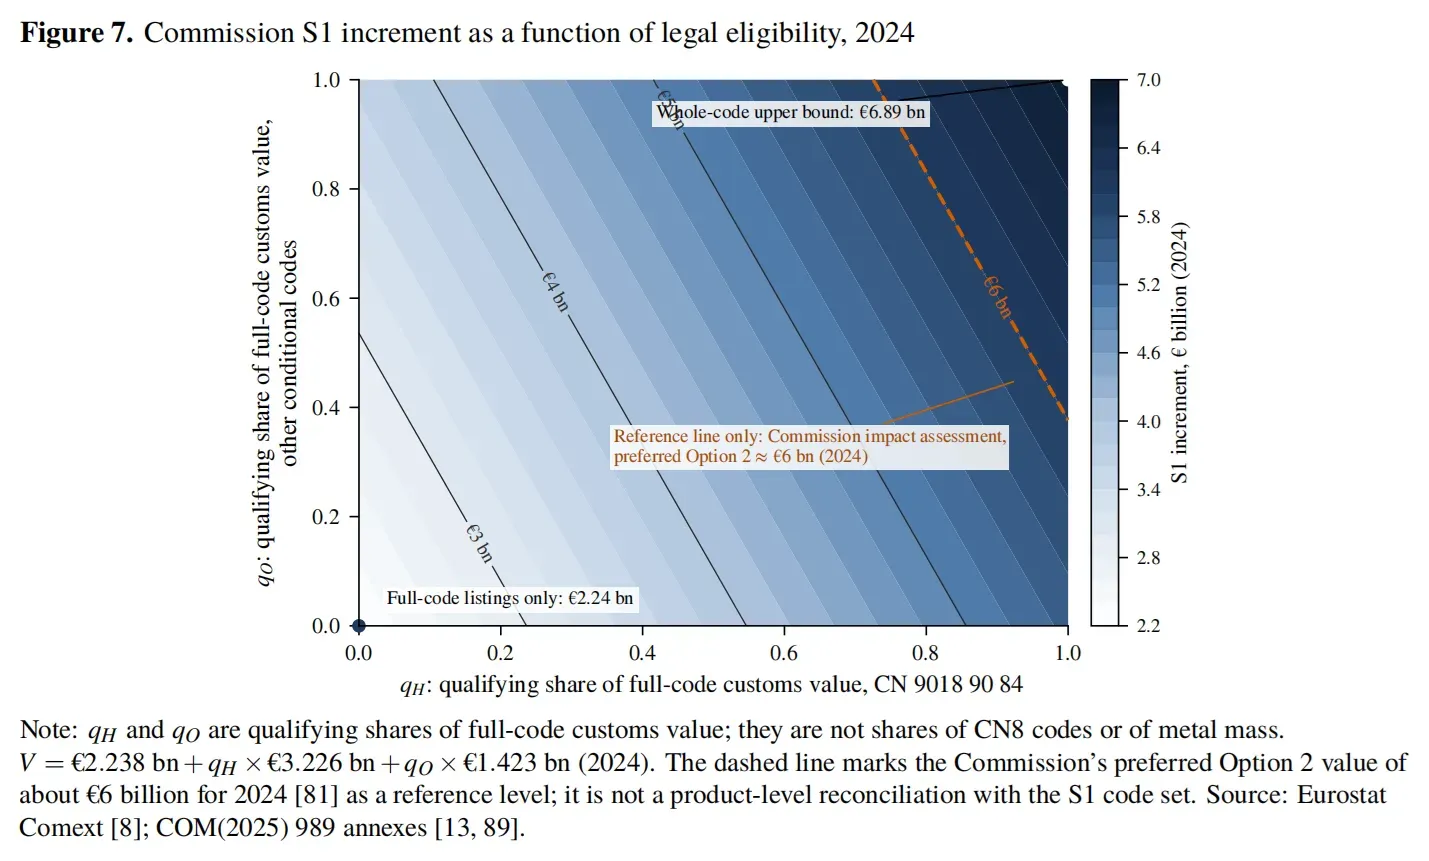
Engineering material constraints and the scope of a finished product
The economic difference between an aircraft turbine and a primary steel product is visible before any carbon calculation. GE engineers’ published CF6 case study reports a material distribution dominated by different high-performance alloys, and the Emerson cryogenic-valve data sheet identifies individual components, materials and whole-unit weights. [19, 20] Siemens Energy’s public SGT-400 specifications provide another industrial-equipment product boundary; the published niobium technology compendium describes specialtyalloy applications in demanding environments. [72, 73] These are manufacturer or original technical sources that establish plausible product families and constraints, not universal material shares for every unit imported under a customs heading. Combined with the Council’s proposed scope language, they support a defensible procedure: classify the finished product, identify steel and aluminum components that satisfy the operative legal definition, bound their eligible precursor masses, and model embedded emissions for that subset. [14]
Consider a 200-kilogram valve with an assumed eligible steel-and-aluminum component share between 45% and 80% by finished mass. The retained candidate metal mass ranges from 90 to 160 kilograms. A lawful downstream certificate calculation then applies the relevant material classification, manufacturing yield, eligible precursor emissions and free-allocation adjustment. [4, 13, 14, 15] If the example valve has an assumed customs value of €20,000, that value reflects the finished assembly, including machining, controls and other manufacturing inputs. The 90–160 kilogram interval is an explicit engineering sensitivity, subject to the material fractions and the final rule; it is separate from the legal qualification of the entire valve and from any observed product-family average.
Three distinct physical quantities in the 8411 and 8481 material analysis
A finished-product composition estimate supplies a mass constraint. [19, 20] It does not by itself determine the mass of legally reportable precursors consumed in production. Let W be the mass of the assembled product in metric tons, and s_k the retained share of material family k, so the retained mass is R_k = W s_k. Let G_ k be gross new material input, S_k recovered scrap or offcut removed from the production process, and L_k unrecovered loss, all measured over a consistent production boundary. Physical conservation requires G_k = R_k + S_k + L_k if internal rework and transfers are eliminated from double counting. An engineering yield y_k = R_k/G_k, bounded between zero and one for this single-output definition, gives G_k = W s_k/y_k. The gross input may exceed retained mass. Internal scrap recycled repeatedly should enter the reconciliation as a return flow, not as a newly purchased input on every cycle. For an illustrative ten-metric ton assembly using the published GE alloy-family percentages cited in A08, the retained iron-base and aluminum-base family masses are respectively 1.6 and 0.8 metric tons. At hypothetical yields of 80% and 90%, the associated gross new inputs are 2.0 and approximately 0.889 metric tons. The differences, 0.4 and approximately 0.089 metric tons, must be assigned to documented scrap and loss streams. These yields are illustrative manufacturing sensitivity assumptions for the hypothetical assembly. The qualified CBAM precursor amount M_qual is a legal mapping of the relevant material and production stream. [4, 13, 14, 15]
It cannot be set equal to R_k or G_k until the legislation’s qualifyingproduct, precursor, treatment-of-scrap and system-boundary rules are applied. The decision test uses two linked models. The first is the manufacturing mass balance, which bounds retained and gross input masses for a representative equipment family. [19, 20] The second is the legal admissibility map, which selects only those feeds, components and process emissions that meet the adopted CBAM rules. [4, 5, 13, 14, 15] For material classes subject to alternative legal treatments, the admissible interval identifies the mass or emissions threshold at which the policy conclusion changes. This preserves the physical advantage of publicly documented engineering while allowing the legal rule to be evaluated separately.
9. Carbon-Cost Comparability, U.S. Competitiveness and Indirect Trade
Competitiveness depends on at least two comparison groups. In the first, U.S. products compete with EU products that fall within the same commercial product class and operate under the EU ETS. In the second, U.S.-origin imports compete with goods from other third countries that may face different defaults, actual emissions, energy costs or eligible domestic carbon prices. A valid comparison therefore aligns the commodity, production route, emissions boundary, import year, quality specification and applicable accounting method. It then accounts for transport, tariffs, contractual pass-through and firm-specific cost adjustments where those differences materially affect the competitive outcome. Regulation 2025/2620 specifies the CBAM free-allocation adjustment for imports, whereas Regulation 2026/1412 publishes domestic EU ETS benchmarks for 2026–2030. [5, 16] The benchmark series summarized in the preceding USTR competitiveness answer is relevant to the EU producer’s allocation position, but its values enter an import comparison only through the product and process mapping required by the CBAM adjustment regulation. The domestic installation’s realized allowance balance also depends on its actual emissions, eligible free allocation and transactions. These separate accounting systems govern the comparison with an otherwise similar imported good. For the U.S.-versus-third-country comparison, law supplies a clearer default-value test. The 2026 originand-route table gives a base default emissions intensity of approximately 1.400 tCO₂e/t for a specified U.S. carbon-steel hot-rolled product under heading 7208 and route C, compared with 3.187 for China and 4.280 for India in the corresponding recorded route comparison. [6, 7]
Where all other legal inputs are genuinely the same, a lower base default reduces the gross emissions term and can confer an advantage on the U.S. source. These figures are country-specific statutory defaults; they do not identify the actual emissions distribution of every U.S., Chinese or Indian steel mill. Their relevance is that a CBAM mechanism can improve the relative accounting position of particular U.S. goods even while creating adjustment and reporting costs across the sector. Ammonia provides the contrasting case. For the same CN 2814 10 00 in 2026, the U.S. base default of 3.410 tCO₂e/t and Algeria’s 2.080 yield, after the common 1% mark-up and illustrative free-allocation adjustment, approximately 1.960 versus 0.617 net certificates/t. [6] The difference is approximately 1.343 certificates/t. At an illustrative €80 per certificate, the legal default-path difference amounts to about €107 per metric ton. This is a meaningful price wedge for a bulk commodity, although it must be considered alongside routespecific verified emissions, supplier production costs, EU tariffs, natural gas input costs and ocean freight. A U.S. facility with a lower verified process intensity could materially narrow that default-path difference if its evidence is admitted on the appropriate legal basis. [5, 7, 29]
The contrast supplies a useful distinction between physical competitiveness and regulatory-evidence competitiveness. An exporter can have technically efficient production yet face a high country default until suitable emissions evidence is accepted. [6] Another exporter can benefit from a relatively low statutory default while its own actual process intensity would be higher if verified. [4, 6, 7] These outcomes are products of the interaction between engineering and accounting rules. The policy interest lies in transparent default construction, coherent production boundaries, equal opportunity to use eligible actual values and efficient verification. [11, 12] These elements make the legal carbon-cost comparison more informative than a simple country ranking. There are also cases in which a lower-emission steel route benefits from verified actual values and cases in which the verified route is less favorable. [6] The break-even values reported in Chapter 5 should therefore be carried into matched-product competition tests rather than averaged away. For a steel product, changing the share of pig iron, DRI and scrap changes the physical emissions and sometimes the precursor adjustment simultaneously. [4] For a fertilizer, the verified ammonia stage can be decisive even when the final mixing process is relatively simple. Any comparative test that holds the physical process constant but changes the legal treatment of one supplier’s evidence should record that change as an institutional condition. [5, 7]
The Parliament’s proposed origin-risk provisions introduce another potential source of asymmetry. [15] If a product-and-origin combination is designated high-risk under a legally adopted framework, the producer’s right to rely on actual emissions could be associated with additional evidence requirements. A reviewable designation based on objective criteria, specific products and a clear test for actual-value evidence would reduce uncertainty for compliant suppliers across origins. The UAN anti-dumping regulation illustrates why trade-remedy findings might be examined in this setting; the existence of an anti-dumping duty does not establish that emissions data are inaccurate or that the country-product pair has been designated for the proposed CBAM safeguard. [21, 22] Each designation should give the measure-specific causal and legal basis for its risk assessment. U.S. economic participation in the European market can also occur through indirect exports. American steel or aluminum may be shipped to Canada or Mexico, incorporated into a finished component and then exported to Europe under the final good’s customs origin. A customs statistic identifying U.S.-origin final goods does not capture all of that upstream American value. Two methods are available. An inter-country input-output model estimates how industries in different countries supply one another and how U.S. value added is embodied in third-country exports. [26, 27]
A physical product model tracks specific material masses, manufacturing yields, precursor origin and corresponding CBAM accounting requirements. The two methods cover, respectively, value added across industry chains and legally eligible metal precursors within finished goods. They are complementary and should be reconciled at an appropriate industry-to-product mapping. Eurostat’s FIGARO inter-country input-output system supplies a 64-industry framework covering the United States, Canada, Mexico and EU economies for 2010–2024. [26, 84, 86] U.S. BEA industry accounts and BLS employment measures complement that framework. [27, 50] The directionally relevant quantity is U.S. industrial value added embodied in EU absorption after at least one productive stage in Canada or Mexico. For any nonnegative industry-coefficient representation, the directed amount lies between zero and the U.S. value-added contribution over all international paths serving the same EU demand. A specific downstream CBAM estimate then filters the relevant industry output through CN classification, qualifying material shares and the legal emissions boundary. The policy conclusions about direct U.S. merchandise and origin-specific defaults rely on the separately observed customs and emissions populations. The economic transmission can nevertheless be defined exactly. Let A be a matrix of intermediate inputs required per unit of industrial output, I the identity matrix, f a vector of final demand and L = (I − A)−1 the Leontief inverse when its standard existence conditions hold. The implied industry production requirements are x = Lf. For country-industry-specific value-added coefficients v, the model can identify a value-added contribution v̂Lf, where v̂ places the coefficients on the diagonal. [27]
An analogous employment coefficient vector estimates gross jobs associated with a specified demand structure. [50] This describes a dependence or exposure measure; a net change in employment under CBAM would additionally require a credible demand shock, substitution response and baseline employment comparison. The competitive implications differ sharply by commodity. Statutory U.S. steel defaults under the specified route compare favorably with those for certain third-country producers. [6, 7] The U.S. ammonia default, by contrast, produces a larger modeled obligation than Algeria’s; the advantage can change when an admissible U.S. installation intensity replaces the country default. [4, 5, 6, 7, 11, 12] Steelmaking with substantial purchased metallic precursors can yield the opposite result, making an actual-emissions filing more expensive than the legally permitted default. [4] For complex machinery, a high merchandise value can coexist with a small eligible metal mass and a substantial documentation burden. [19] Each finding points to a different administrative intervention: default-value review, access to verification, precursor accounting or productmaterial qualification.
Energy inputs, value-added chains and the limits of national averages
The physical production route determines how electricity and fuel enter carbon and financial costs. The U.S. Energy Information Administration publishes annual and monthly industrial electricity prices by state, not merely a national average. [70, 71] For a technology that uses (e) kilowatt-hours (kWh) of purchased electricity per metric ton of finished product, and pays (p_e) dollars per kWh, the direct electricity expenditure is (e p_e) dollars per metric ton before demand charges or other contractual adjustments. If (e=600) kWh/t and (p_e=0.08) USD/kWh, the illustrative energy bill is USD 48/t. This model isolates the input-cost effect of electricity. CBAM-relevant indirect emissions, where legally counted, still require the appropriate electricity factor and emissions-accounting rules; a utility bill is not itself a measurement of embedded CO2 . The official state-by-state series can narrow the feasible price range when a production region is known. [70, 71]
An indirect-export claim demands a separate accounting object. U.S.-origin steel may enter Canadian or Mexican machinery before that machine is exported to the EU, but the U.S. value added embodied in the later shipment is neither the gross shipment value nor the physical steel mass by default. Eurostat’s 2026 FIGARO release makes 64-industry inter-country input–output and supply/use structures available for years 2010–2024. [26, 84, 86] U.S. BEA supply/use and requirements tables document the domestic inter-industry relationships, and BLS industry employment data allow a carefully defined labor-intensity conversion. [27, 50, 51, 52, 78] A time- and classification-matched cross-country implementation is necessary before this report can report numerical American employment effects. Reported employment needs an additional bridge. [27, 50] Employment coefficients in workers per million dollars of real industry output depend on both the base year and the price deflator; applying them directly to nominal CN8 customs values would mix units and industry definitions. A consistent design first maps customs products to the relevant industry, estimates a value-added or output shock under an explicit trade scenario, then applies matched employment coefficients. Even when that calculation is completed, the output is a scenario estimate; observed change in payroll employment must be obtained from employment statistics and compared against an appropriate benchmark. The BLS projections documentation sets out the production, final-demand, output and employment sequence underlying its own industry modeling, which is relevant to this design. [50]
Cash compliance, economic opportunity cost and the price transmitted to buyers
A useful EU-to-import competition comparison has three separate ledgers. The cash-compliance ledger tracks allowance purchases, sales and the legally required net CBAM certificate cost in the relevant period. [39, 40] The economic marginal-cost ledger values any allowance that must be surrendered, including an allowance received free of charge when it could otherwise be sold or retained for an alternative use. The market-price ledger asks what portion of a cost or opportunity cost enters the transaction price under competition, contracts and available substitutes. Suppose an EU plant has annual verified emissions E, free allowances A, a market allowance price P, and a tradable stock of allowances. [39, 40]
The simplified net annual cash purchase before banking and other trades is P × max(0,E − A). Where unused allowances may be sold at the same market price, the net cash balance from buying and selling allowances is instead P × (E − A), which can be negative. Holding output and the allowance allocation fixed, reducing physical emissions by one metric ton saves approximately P in surrendered allowance value, even when E < A; the allocation may determine cash flow without eliminating the opportunity cost of emissions. If extra output changes the allocation, the incremental allocation response must be included separately. This is an economic representation of tradable allowances, not a substitute for the installation-specific allocation rules or trading records. For an EU importer, let q be the legally required CBAM certificates per metric ton of imported product, P_c the applicable purchase price per certificate and M_i the per-metric ton accounting, financing and verification expense. Its simplified cash burden is P_c q + M_i, before any additional treatment already included in the legal certificate quantity. [2, 5, 43] For an EU producer, marginal carbon-related economic cost is closer to P × (∂ E/∂ Q − ∂ A/∂ Q) where Q is output, provided the allowance allocation changes with output and relevant market conditions are held fixed. [39, 40]
The EU producer’s actual carbon-related selling-price response also depends on cost pass-through. Defining τ as the fraction of a cost change transmitted to its buyer, with 0 ≤ τ ≤ 1 in a simplified partial-equilibrium case, yields ∆p ≈ τ ∆c for a comparable unit of product. A legal obligation’s magnitude therefore does not mechanically equal the resulting price premium. Suppose each produces one metric ton with 2.0 tCO₂e of emissions, each faces an allowance price of €80 and each has access to 1.5 allowances of free allocation under a simplified fixed-output ledger. Both initially need to acquire only 0.5 allowances in net terms, a €40 cash-purchase calculation. But the opportunity value of 2.0 surrendered tradable allowances is €160. If a change in output or a different product benchmark alters the marginal allocation, the incremental cost changes again. A border example with q = 0.5 would likewise imply €40 of certificate expenditure at the same price, yet this arithmetic equality would not establish identical production costs, marginal incentives or consumer prices across the two industries. Every comparative table in this report should therefore label whether it displays cash purchase, opportunity cost, delivered cost or price incidence.
Quantitative cross-check against the Commission’s macroeconomic assessment
The Commission’s impact assessment reports that by 2035 its three downstream options would lower overall EU downstream imports by 0.08%, 0.29% and 0.35% relative to their respective baseline. [81] It also estimates that consumer-price effects remain small across broad EU expenditure categories, while warning that imported downstream goods often represent intermediate rather than final consumer products and that pass-through depends on competition and value-chain depth. These modeled findings can be used to test whether a proposed U.S.-specific shock assumes implausibly complete price transmission through several production layers. They do not set a universal upper bound on a particular turbine spare part or ammonia transaction. A matched-product comparison can express the price-reversal threshold directly. Let c_US^0 and c_X^0 be the non-CBAM delivered costs per product unit for U.S. supply and competitor X; let ∆CBAM_US and ∆CBAM_X be their legally comparable CBAM-related cost increments. The relative delivered price changes sign when (c_US^0 − c_X^0) + (τ _US ∆CBAM_US − τ _X ∆CBAM_X) = 0, where each τ represents the relevant cost transmission into the transaction price. With route-specific legal costs calculated, this equation identifies the initial price advantage or transmission rate required for CBAM to reverse the ranking. Freight, duties and industrial energy prices can be entered as observed inputs or explicit ranges.
Isolating U.S. value added transmitted through Canada and Mexico
The Eurostat FIGARO framework supplies inter-country input-output tables and employment-linked indicators at the level of 64 industries and products, including the United States, Canada, Mexico and EU economies. The 2026 edition covers 2010–2024 in nominal million euros at basic prices. [26, 84] The 2024 reference year is therefore an admissible macroeconomic baseline for tracing industrial interdependence, but it is not a 2026 observation. It is also broader than the actual CN8 legal product list. The price, geography and industry population must be held explicit during the bridge from FIGARO to customs classifications.
Directed value-added pathways and the CBAM customs boundary
A customs-origin statistic identifies the finished product entering the EU; inter-country input-output accounting instead estimates the U.S. value added embodied in production undertaken abroad. [26, 84, 86] For American material processed in Canada or Mexico, the directional contribution is bounded below by zero and above by total U.S.-origin value added serving the relevant EU absorption population. Industry-level figures must be screened against the legally applicable customs products and metal qualifications before they can describe CBAM-covered trade. [8, 13, 14, 15]
10. The Nitrogen Fertilizer Chain: Defaults, Precursors, Trade Measures and Market Behavior
The U.S. ammonia and nitrogen-fertilizer chain provides a complete example of how carbon accounting, industrial processes, existing trade measures and observable purchasing decisions interact. The physical sequence begins with ammonia production, continues through urea and nitric-acid pathways, and reaches ammonium nitrate and urea-ammonium nitrate mixtures. The products occupy separate customs classifications and may be subject to different combinations of direct, indirect and precursor emissions. [4] Anhydrous ammonia is CN 2814 10 00, aqueous ammonia is CN 2814 20 00, and UAN mixtures are CN 3102 80 00. Their classification and process boundaries matter independently even though they belong to a connected value chain. [29, 37]
The United States has a substantial industrial basis for this chain. The U.S. Geological Survey’s Mineral Commodity Summaries 2026 reports that 18 companies operated 38 ammonia plants in 19 states during 2025, with one plant idle for the full year. Approximately 57% of national ammonia production capacity was in Louisiana, Oklahoma and Texas, where natural gas availability supports ammonia production, and active plants operated at roughly 80% of rated capacity. [31] These observed structural parameters allow scenario analysis of capacity, regional production concentration and the physical limits on rapid supply adjustment. They also explain why a short-term change in export destination can be more feasible than an immediate wholesale conversion of a mature production facility to a new low-carbon production process. At the CBAM accounting level, U.S. anhydrous ammonia’s base default of 3.410 tCO₂e/t leads to the 2026 net D0 model result of 1.96015 certificates/t under the stated rule. [5, 6, 7]
The adjusted model result for a hypothetical eligible actual process intensity of 2.00 tCO₂e/t is about 0.516 certificates/t. The difference creates a clear commercial incentive to assemble usable verified evidence when the cost of doing so is lower than the certificate benefit. The derivation of the country default from underlying production mixes and the share of U.S. installations operating below that value determine the potential scale of the verification incentive. The implementing regulation publishes the operative number, while a fully transparent public derivation would help suppliers judge which production data can make a material difference. Ammonia, urea, ammonium nitrate and UAN can involve different actual- and default-value methods for a finished product and its precursors. [4] When the free-allocation adjustment for a default precursor is calculated at the precursor stage, the tested fully actual-value declarations for urea, ammonium nitrate and UAN yield lower net obligations than their fully default counterparts. An alternative final-product treatment of the same precursor adjustment changes the ranking of mixed and fully actual declarations for selected lateryear scenarios. The relevant legal calculation requires a consistent interpretation of precursor allocation and the producer’s actual production boundary. [5, 6, 7]
Other trade rules change the landed price independently of carbon. Commission Implementing Regulation (EU) 2026/65, adopted after an expiry review, imposes definitive anti-dumping duties on specified UAN mixtures originating in the United States, Russia and Trinidad and Tobago. [21] The regulation identifies a
U.S. duty of €29.48 per metric ton for the relevant named producer and other applicable entries as specified by the regulation. [21] That amount represents an anti-dumping duty under a trade-remedy instrument; it must be tracked independently from CBAM certificates, ordinary customs tariffs, transport and contractual costs. A proposed CBAM risk assessment that refers to trade-remedy findings would be a further legal mechanism, not a retroactive redefinition of this duty. The market evidence begins with two different observation systems. Eurostat’s customs record provides the EU27’s declared mass and value of U.S.-origin anhydrous ammonia imports. The 2025 aggregate is approximately 295,575 metric tons, valued at €127 million [8]; the 2026 first-quarter Comext observation records about 38,912 metric tons [9]. S&P Global Commodity Insights, using Platts vessel tracking and trader interviews, separately reported European seaborne ammonia arrivals of approximately 787,000 metric tons in the fourth quarter of 2025 and 717,000 metric tons in the first quarter of 2026. [18] In that maritime series, U.S.-to-EU deliveries fell from roughly 90,000 to 40,000 metric tons, U.S.-to-Norway shipments rose from zero to about 39,000 metric tons, and within-EU seaborne movements increased from about 116,000 to 185,000 metric tons. [18]
The customs and vessel systems measure different observation universes, but their U.S. first-quarter volume magnitudes are broadly compatible. The vessel figures are commercially informative because they show a change in routing during the first quarter of the definitive CBAM phase and document market participants’ contemporaneous concern about default emissions costs. [18] Several mechanisms can produce the same quarterly pattern: purchases brought forward before January 2026, ordinary seasonality, destination switching, inventory changes, relative price shifts, freight availability and the combined influence of tariffs and CBAM. The approximately 50,000-metric ton fall in observed U.S.-to-EU seaborne movements represents only a small number of large ammonia cargoes. Norway’s increase, equivalent to about 78% of that recorded U.S.-to-EU decline in simple mass terms, is a useful competing-routing hypothesis. [18] It does not establish that specific cargoes were diverted from a specific EU customer because of CBAM.
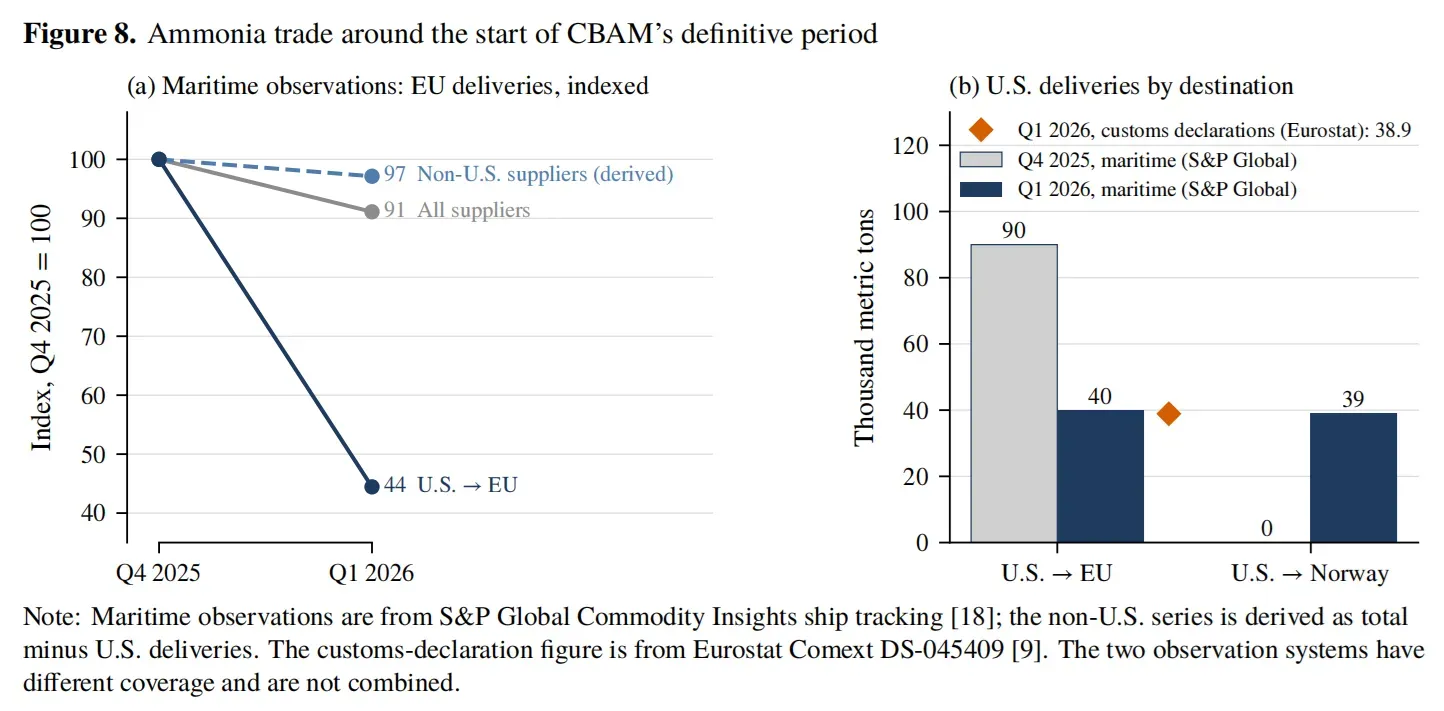
The two principal comparison errors would be to attribute the quarter-to-quarter change entirely to CBAM or to merge different statistical vintages as if they shared the same denominator. World Bank WITS and UN Comtrade partner records can yield a different 2025 U.S.-to-EU ammonia quantity from the Comext record because of reporting and update differences. For example, a WITS data series reports approximately
268,000 metric tons, compared with approximately 296,000 metric tons in Comext. [8, 32] Each source should retain its retrieval date, reporting unit and coverage when calculating U.S. market share or a competitor ranking. Differences between Comext and WITS observations, together with seasonal movements in ammonia shipments, provide a basis for targeted customs-data reconciliation and comparable time-series analysis. [9, 18]
U.S. ammonia deliveries to the EU fell in the maritime observation period [18] while the modeled U.S. default-route certificate obligation exceeded the Algerian comparator. [6, 7, 32] The shipping record is also compatible with pre-2026 purchasing, seasonal cargo movements, freight costs and alternative destinations. USTR can therefore prioritize default-value disclosure and access to verified installation emissions while using comparable seasonal cargo and price observations to evaluate the contribution of CBAM to any sustained change in demand.
A conditional price-reversal test for the U.S. and Algeria
WITS/UN Comtrade’s 2025 EU import unit values for U.S. and Algerian ammonia supply the historical comparison. [32] At a stipulated €80 certificate price and US$1.16 per euro, price parity occurs at approximately 55.3% transmission of the modeled default-route carbon-cost difference; at US$1.10 per euro it occurs at 58.3%. [5, 6, 7, 32] The historical unit values aggregate different contracts and shipments, so the model identifies price conditions rather than an observed switch in purchasing decisions. [5, 7]
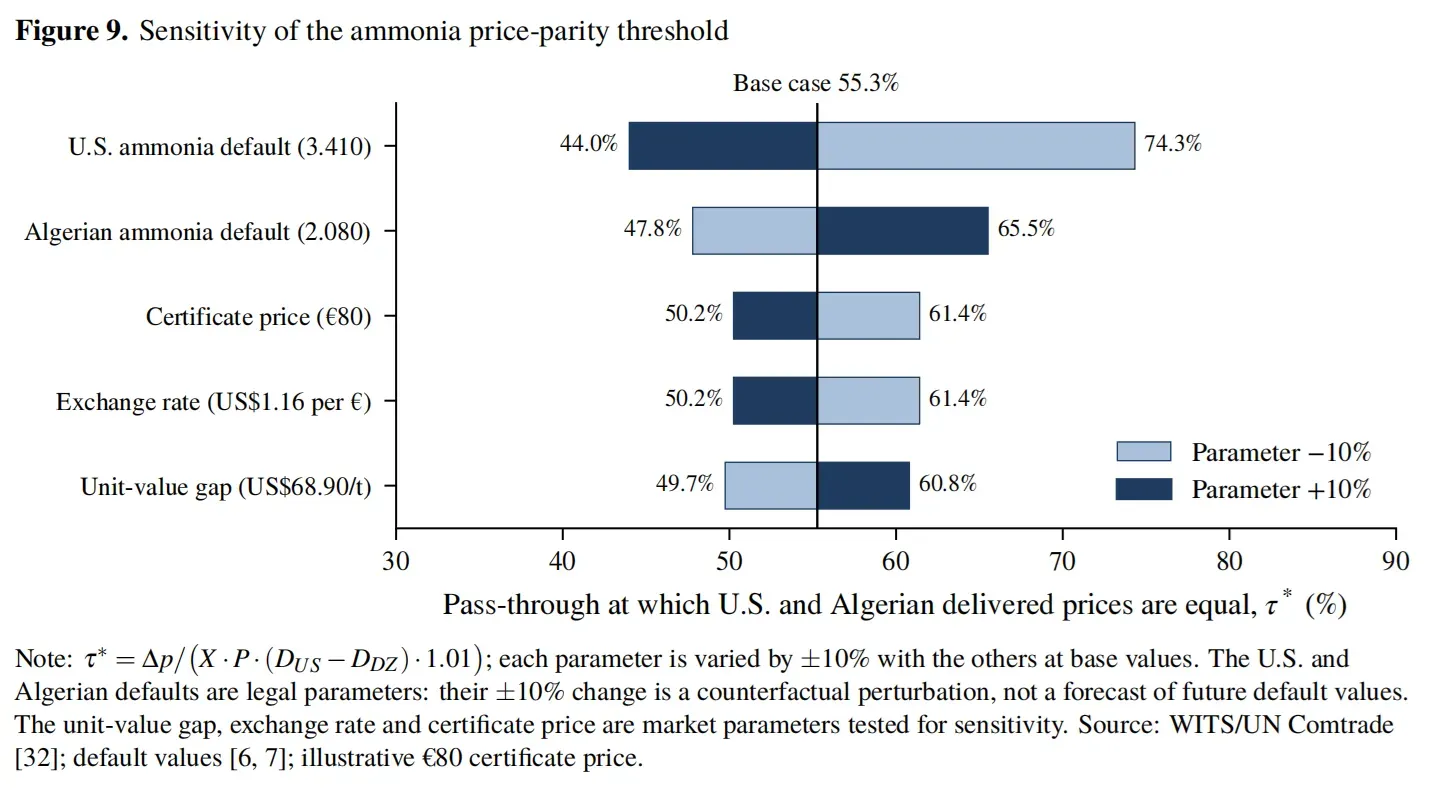
The method also tests the policy consequence of access to qualified actual emissions. [4] With 2.00 tCO₂e/t stipulated for an admissible U.S. plant and all other legal-parameter choices held constant, the net unit position improves to 0.51605, below the Algerian default value of 0.61685. [6] The corresponding actualemissions intensity for equality of net certificates is approximately 2.1008 tCO₂e/t under the specified common adjustment. Both results depend on that plant’s real emissions boundary and eligibility; the calculations identify a threshold worth verifying at facilities that participate in the EU market. [5, 7, 29]
Production geography, feedstock and competing observed trade channels
The U.S. Geological Survey’s nitrogen statistics describe the sequence from fixed nitrogen and ammonia to urea, nitric acid and other fertilizer intermediates. [64] Its 2026 Mineral Commodity Summaries provide a dated, reproducible view of U.S. ammonia capacity and industrial structure. [31] The EPA’s ammonia-manufacturing reporting category supplies process definitions [58], while the IEA’s roadmap supplies technology-specific energy and emissions pathways [29]. Together, these sources support analysis of feasible supply responses to a CBAM cost differential, distinct from demand responses among EU fertilizer buyers. Eurostat measures EU27 imports using CN8 and partner-origin fields, while the U.S. Census Bureau records U.S. exports by Harmonized System product and destination. [8, 56] A mirror comparison for ammonia HS6 281410 would align year, month, customs valuation, mass, reporting partner and product coverage. Timing, transshipment, reporting revisions and valuation conventions form explicit reconciliation categories. The existing EU import series supplies the observed shipment baseline; the American export mirror is a separate measurement channel for evaluating origin and timing. [9, 32, 53]
11. Legal Instruments, Applicable Tests and U.S. Paths to Remedy
The appropriate U.S. response depends on the specific EU measure, its legal status and the injury or trade restriction that can be established. A published emissions default, a decision rejecting a verifier’s accreditation, a future country-product risk designation and an ambiguous annex entry require different kinds of correction. The most direct path for one problem may be a technical amendment or review by the European Commission, while another may warrant a trade-law assessment under U.S. legislation or the World Trade Organization (WTO) agreements. [23, 24, 25] The analytical task is to connect each measure to a legal obligation, an observable effect and an available institutional remedy, rather than treating all concerns about CBAM as one dispute. For current default values and actual-emissions treatment, the first avenue is the procedure already within EU law. [4, 6] Implementing Regulation 2025/2547 Article 11(5) requires the Commission to review default values by December 2027 at the latest. [4] Regulation 2025/2621 establishes the default-value system, while Regulation 2026/1740 corrected the annex tables and retained the relevant sectoral mark-ups. [6, 7]
Review can therefore address the choice of country-and-route data, physical production boundaries, transparent treatment of precursors and the sensitivity of high-default products such as American ammonia. [6, 7] The requested administrative output should be an identifiable methodology, a dated source register, an accountable review timetable and corrections where the underlying evidence warrants them. Those outputs can improve legal precision regardless of whether a separate international trade dispute is eventually pursued. Verifier accreditation and evidence acceptance also have an immediate route. Current EU law permits a qualified verification body outside the Union to seek accreditation through a competent EU national accreditation body, with requirements set out in the implementing and delegated regulations. [11, 12] The proposed amendment to Article 2(12) would add an agreement-based route to recognition of third-country accreditation bodies, subject to appropriate equivalence requirements. [2, 13, 14, 15] U.S. agencies and EU counterparts can examine whether accreditation scopes, audit documentation and reporting interfaces can be made interoperable while preserving the underlying verification standard. An exporter that supplies adequately verified emissions evidence should have a clear and reviewable explanation if a competent authority declines to use that evidence for the relevant calculation. [13, 14, 15]
For downstream scope, the greatest opportunity for correction is during the legislative process. The Council’s Recital 43 establishes an interpretive basis for excluding certain products composed entirely of out-of-
scope materials, while the Parliament’s 8481 00 reference requires a valid customs description. [14, 15] EU legislative and implementing authorities can settle these matters in text before firms make extensive productfamily and supplier-data investments. The requested corrections should identify precise CN8 or TARIC entries, applicable ex conditions, evidence for determining eligible materials, the treatment of alloys and precursors, and a procedure for reconsidering a disputed decision. These are implementable rules whose effect can be monitored through classification decisions and subsequent reporting outcomes. The Parliament’s proposed Article 6(7) origin-risk mechanism merits an additional procedural safeguard. [15] Risk classification should identify the products and origin combinations concerned, the factual criteria used, the reason why existing evidence processes are insufficient and the type of installation evidence needed to obtain actual-value treatment. A time-limited decision should be reviewable when new data become available. Such design features preserve the proposal’s stated protection against circumvention while reducing the probability that a country-wide inference unnecessarily overrides a producer’s substantiated process record. Existing EU anti-dumping measures may inform a legal inquiry, but any CBAM designation should be supported by the factual elements required by the adopted provision. [21, 22]
U.S. Section 301: measure-specific screening and investigation
Section 301 of the Trade Act of 1974, codified principally in 19 U.S.C. § 2411, empowers the United States Trade Representative to respond, under specified statutory conditions, to denial of U.S. rights under trade agreements or to certain unjustifiable, unreasonable or discriminatory foreign acts, policies or practices that burden or restrict U.S. commerce. [23] Sections 2412 and 2414 address initiation and determinations, with consultation and procedural requirements addressed elsewhere in the statutory framework. [24, 48] The distinction between investigating a specific measure and taking a remedy is important. The former can begin with a defined legal hypothesis and an evidence plan; the latter requires the findings and procedures contemplated by the Act. [23, 24, 48]
The CBAM research supplies several suitable objects for a pre-investigation or investigation screening file: a current country default with an identified comparable-technology problem; an operational decision denying eligible actual-emissions evidence; a burdensome and unjustified accreditation restriction; or a future product-and-origin risk rule that produces a demonstrable differential administrative burden. [24] For each candidate, USTR can document the legal text, the affected products, the change in compliance or cost outcomes, the availability of less restrictive correction and the connection to U.S. commerce. [23, 24] The verified €3.90 billion current-scope trade value and the €10.66–31.02 billion range of proposal-specific nominal goods values establish the potential surface of exposure. [8, 13, 14, 15] They do not establish the different statutory elements required for every Section 301 finding. [23] A targeted investigation should be decided on the applicable legal and commercial evidence rather than on the size of the largest nominal customs value. Section 232 serves a different statutory purpose. The Department of Commerce investigates whether imports into the United States threaten to impair national security. [34] It is not the ordinary instrument for assessing CBAM’s treatment of American goods exported to the EU. Any separate national-security issue would require its own factual basis under that statute; this report’s core trade and regulatory questions are better mapped to EU law, Section 301 and applicable international trade rules. [79]
WTO rules and the importance of classifying the disputed obligation
WTO law supplies several possible tests, but their applicability must be determined from the measure’s legal characteristics. GATT Articles I and III provide the relevant origin- and national-treatment tests for an identified CBAM charge or process, assessed against the legally comparable products and conditions. [25]
A proposed challenge would need to identify the measure at issue, its legal classification, the relevant like or
comparable products and the differential treatment alleged. The legal test turns on comparable products, the measure’s classification and the treatment applied. The EU could invoke GATT Article XX, including its relevant environmental exceptions, in relation to a challenged measure. [25] Such analysis would examine the conditions of the applicable paragraph and the Article XX chapeau, including requirements concerning arbitrary or unjustifiable discrimination or disguised restrictions. Article XX is therefore a potential legal justification raised in analyzing a measure; it is not itself the cause of action by which the United States alleges an EU violation. A serious assessment must consider the EU’s environmental policy rationale, the relationship between its domestic EU ETS system and the imported-goods mechanism, and the availability of administrable and comparably effective alternatives. The WTO Agreement on Technical Barriers to Trade (TBT Agreement) raises a separate threshold question. [25, 49] A particular monitoring, product-description or conformity-assessment requirement may fall within its definitions of a technical regulation or conformity-assessment procedure, but that determination must precede application of its non-discrimination, transparency or recognition provisions. Relevant provisions include Articles 2, 5 and 6 and the definitions in Annex 1. One should not assume that every financial obligation arising from a carbon-price system is a covered technical regulation. The more promising concrete analysis concerns a specified accreditation, testing, verification or product-material rule whose functional and legal features can be examined directly.
An escalation sequence tied to measurable outcomes
A graduated course of action allows the United States to obtain corrections promptly while preserving formal legal options. At the initial level, USTR can submit clause-specific comments and engage EU institutions on default transparency, verifier accreditation, downstream product definitions and high-risk designation procedures. At the second level, U.S. agencies can coordinate data and accredited-verifier capacity and collect documented examples of a particular rule’s trade effect. At the third level, if the evidence and applicable statutory conditions support it, USTR may consider initiating a Section 301 inquiry or the United States may evaluate WTO consultations and dispute processes. [23, 25] The level of response follows the legal status and demonstrated operation of the measure rather than the sequence of press reports or inferred motivations. [24]
Three decision windows make this sequence operational. First, the current EU legislative negotiations provide an opportunity to correct the legal design before downstream rules enter into force; the governing event is formal adoption and publication, not an assumed date for a particular trilogue. Second, the Commission’s review of default values is legally scheduled no later than December 2027, and technically documented U.S. process submissions can inform that review. [4, 6] Third, the 2027 issuance of first verification reports, beginning of certificate purchases and annual declaration deadline will produce new operational evidence about services, costs and evidence acceptance for 2026 imports. [2, 3, 11, 12] Each window can supply an observable result, such as a corrected annex, a recognized accreditation procedure, a documented review decision or an enforceable administrative clarification. For any potential legal escalation, the working file should contain a stopping condition. If the adopted law resolves the classification defect, eligible actual values can be used on equivalent terms, or the anticipated burden does not materialize in the relevant commercial channel, the legal hypothesis may no longer support further escalation. Conversely, recurring documented refusal of qualifying emissions evidence, a persistent differential rule without adequate explanation or an identified restriction on U.S. commerce can justify more intensive statutory review. [23, 24, 25] This is a mechanism for directing enforcement resources toward specific, correctable problems and making their resolution measurable.
12. Policy Implications, Decision Windows and Implementation Indicators
The strongest result is the concentration of CBAM exposure in a small number of distinct legal and industrial mechanisms. Bulk inputs dominate measured import mass, but the largest proposed increases in nominal merchandise value occur in complex downstream codes whose goods and metal precursors cannot be inferred from customs value alone. [4, 8, 13, 14, 15] For USTR, transparent default-value derivation and a usable route to verified actual emissions are immediately relevant to current goods. [4, 6, 7, 11, 12] Under the proposed expansion, material eligibility and valid CN classifications become equally consequential. Ammonia illustrates the commercial stakes of an admissible evidence pathway: under the stated 2026 rules, the U.S. default exceeds Algeria’s, while an eligible lower-intensity U.S. facility could change the ranking. Specified U.S. hot-rolled steel defaults may confer the opposite advantage against certain third-country routes. [6] Neither observation defines an economy-wide effect. The practical decisions concern which legal accounting route a plant can use, whether the benefit exceeds verification expense, and whether importers change procurement at the resulting delivered cost. [4, 7, 29]
Seven recommendations set out in the original USTR submission address those decisions through separate institutions. A technical submission to the Commission on default values or verification can be pursued under existing rules; downstream classification and product-origin safeguards depend on the pending legislative text. [2, 5, 6, 15] A Section 301 or WTO response requires its own measure-specific legal and commercial record. [23, 24, 25] Evidence that an administrative correction has resolved the disputed treatment should also inform whether a formal investigation remains warranted. Three decision windows follow from the legal calendar. During EU legislative negotiations, USTR can seek enforceable material tests and valid CN references for the proposed downstream goods. [13, 14, 15]
Before the December 2027 review deadline, it can submit process-specific evidence on default values and the availability of verifier services. [4, 6, 7, 11, 12] The first 2027 declarations and surrender for 2026 imports will then supply information about accepted evidence, actual certificate expenses and compliance administration. [2, 3] Questions about enforcement should be reassessed against that operational record and the applicable statutory tests. [23, 24, 25]
A practical monitoring program would retain monthly and annual import values and mass by valid CN8 code [8, 9], the use of default or actual emissions when available [4, 6], verifier accreditation scopes [17], evidence rejections, certificate purchases, and documented commercial responses. Recorded 2026 trade, 2027 payment information and later observations should remain separately dated. Where a policy measure changes, the economic comparison should also identify the corresponding untreated or otherwise comparable products and periods before attributing a market movement to CBAM. The hydrogen-weight scenarios produce approximately 2.435 million certificates excluding hydrogen, 2.444 million at a 2024-unit-value-implied hydrogen mass, and 3.827 million using the reported 2025 hydrogen mass. [5, 6, 7, 8, 9] The current 50-metric-ton importer threshold applies to an importer’s relevant cumulative annual goods; the Commission’s 0.87% exemption estimate describes an EU-wide emissions population. [3, 30] The Parliament’s 8481 00 textual alternatives differ by approximately €2.24 billion of 2025 wholecode merchandise value. [8, 15] These sensitivities identify changes in physical or legal scope capable of altering the policy comparison.
Testable effects of the proposed measures
Against the observed 2025 U.S. ammonia flow of approximately 296,000 metric tons, a stipulated €80 certificate price gives approximately €31.8 million in gross certificate savings if the base default were hypothetically reduced from 3.410 to 2.080 tCO₂e/t. [5, 6, 7, 8] A distinct eligible 2.00 tCO₂e/t actual-emissions route produces about €34.2 million of savings; a separately eligible third-country carbon-price deduction of €10/t corresponds to €3.0 million. [2, 4, 5, 6, 7] Each amount uses the same reference quantity, and the interventions overlap. For Parliament’s 8481 entry, the two readings differ by approximately €2.24 billion in 2025 whole-code nominal imports, before material eligibility and certificate accounting. [8, 15] Under the Commission’s Option 2 cost model, a 10% reduction in the €8–43 million EU-wide incremental annual importer compliance-cost range corresponds to €0.8–4.3 million for that modeled importer population. [81] The contractual allocation of those savings determines any benefit to U.S. producers.
References
[1] Office of the United States Trade Representative. (2026, October 8). Request for Comments on the Effect of the European Union’s Carbon Border Adjustment Mechanism and the Proposals To Expand Coverage on U.S. Trade. 91 Federal Register 64450–64452, Docket USTR-2026-0661, Document 2026-20615.
[2] European Parliament and Council of the European Union. (2023). Regulation (EU) 2023/956 establishing a carbon border adjustment mechanism, as amended. Official Journal of the European Union.
[3] European Parliament and Council of the European Union. (2025). Regulation (EU) 2025/2083 amending Regulation (EU) 2023/956 as regards simplifying and strengthening the carbon border adjustment mechanism. Official Journal of the European Union.
[4] European Commission. (2025). Commission Implementing Regulation (EU) 2025/2547 laying down rules for the application of Regulation (EU) 2023/956 as regards the methods for calculating emissions embedded in goods. Official Journal of the European Union.
[5] European Commission. (2025). Commission Implementing Regulation (EU) 2025/2620 laying down rules on the calculation of the free allocation adjustment to the number of CBAM certificates to be surrendered. Official Journal of the European Union.
[6] European Commission. (2025). Commission Implementing Regulation (EU) 2025/2621 concerning the establishment of default values for embedded emissions for the definitive CBAM period. Official Journal of the European Union.
[7] European Commission. (2026). Commission Implementing Regulation (EU) 2026/1740 correcting the annexes to Implementing Regulation (EU) 2025/2621. Official Journal of the European Union.
[8] Eurostat. (2026, data extracted October 27–28). International Trade in Goods, detailed EU trade since 1988 by CN8 (Comext), dataset DS-045409: EU27 imports from the United States, annual 2024 and 2025, indicators VALUE_IN_EUROS and QUANTITY_IN_100KG. European Commission, Eurostat dissemination API.
[9] Eurostat. (2026). Comext DS-045409: EU27 monthly imports from the United States, CN8, including August 2025 and January–August 2026 reporting periods. European Commission, Eurostat. The monthly series is distinguished from the annual 2024–2025 observations in [8]; methodology and API documentation are listed separately in [54].
[10] European Commission, Directorate-General for Taxation and Customs Union. (2026). CBAM verification: accreditation framework, verification of non-EU installations and 2026–2027 implementation timeline.
[11] European Commission. (2025). Commission Implementing Regulation (EU) 2025/2546 on the application of CBAM verification principles. Official Journal of the European Union.
[12] European Commission. (2025). Commission Delegated Regulation (EU) 2025/2551 on CBAM accreditation and verification. Official Journal of the European Union.
[13] European Commission. (2025, December 17). COM(2025) 989 final: Proposal for a Regulation amending Regulation (EU) 2023/956 as regards the extension of its scope to downstream goods and anti-circumvention measures.
[14] Council of the European Union. (2026). ST 10423/26: Proposal for a Regulation amending Regulation (EU) 2023/956 as regards the extension of its scope to downstream goods and anti-circumvention measures, General Ap- proach.
[15] European Parliament. (2026, September 15). P10_TA(2026)0276: Amendments adopted on the proposal for a Regulation amending Regulation (EU) 2023/956 as regards extension to downstream goods and anti-circumvention.
[16] European Commission. (2026). Commission Implementing Regulation (EU) 2026/1412 determining revised EU ETS free-allocation benchmarks for the 2026–2030 period. Official Journal of the European Union.
[17] Accredia. (2026, September 28). Decision of the Sector Accreditation Committee for Inspection and Verification, CBAM accreditation activity scopes (signed resolution).
[18] S&P Global Commodity Insights. (2026, April 15). Europe’s ammonia imports fall in Q1 as buyers shun US product under CBAM. Original published ship-tracking and market-participant reporting, not a customs-statistics series.
[19] Schafrik, R. E., Ward, D. D., & Groh, J. R. (2001). Application of Alloy 718 in GE Aircraft Engines: Past, Present and Next Five Years. In Superalloys 718, 625, 706 and Various Derivatives, pp. 1–11. The Minerals, Metals & Materials Society.
[20] Emerson. (2025). KTM Novatite Extreme Cryogenic Ball Valve: Technical Data Sheet, manufacturer specifications and parts/materials/weight tables.
[21] European Commission. (2026). Commission Implementing Regulation (EU) 2026/65, EU trade-remedy measure relevant to U.S.-origin urea and ammonium nitrate solutions. Official Journal of the European Union.
[22] European Commission. (2022). Commission Implementing Regulation (EU) 2022/58, EU trade-remedy measure involving grain-oriented flat-rolled products of silicon-electrical steel. Official Journal of the European Union.
[23] United States Congress. Trade Act of 1974, Section 301: Actions by United States Trade Representative, 19 U.S.C. § 2411, current statutory text. Office of the Law Revision Counsel.
[24] United States Congress. Trade Act of 1974, Section 302: Petitions and initiation of investigations, 19 U.S.C. § 2412. Office of the Law Revision Counsel.
[25] World Trade Organization. (1994). General Agreement on Tariffs and Trade 1994, including Articles I, III and XX. Official WTO legal text.
[26] Eurostat. (2026). FIGARO inter-country supply, use and input-output tables, 2026 release and associated source database. European Commission.
[27] U.S. Bureau of Economic Analysis. Input-Output Accounts Data. U.S. Department of Commerce.
[28] European co-operation for Accreditation. (2026, October 6). EA-6/05 INF: EU CBAM cooperation of foreign national accreditation bodies with local national accreditation bodies in third countries.
[29] International Energy Agency. (2021). Ammonia Technology Roadmap: Towards more sustainable nitrogen fertiliser production. Industrial process, technology and emissions-intensity reference data.
[30] European Commission, Directorate-General for Taxation and Customs Union. (2026, September 30). CBAM De Minimis Threshold Assessment. Official assessment of the Article 2a 50-metric-ton importer threshold and the 0.87% embedded-emissions estimate.
[31] U.S. Geological Survey. (2026). Mineral Commodity Summaries 2026, “Nitrogen (Fixed)—Ammonia,” version 1.3, revised May 2026. U.S. Department of the Interior.
[32] World Bank, World Integrated Trade Solution (WITS), using UN Comtrade data. (2026 retrieval of reference year 2025). European Union imports, HS 281410 anhydrous ammonia, by partner. Source vintage maintained separately from Eurostat’s CN8 Comext extraction.
[33] Vidovic, D., Marmier, A., Zore, L., & Moya, J. A. (2023). Greenhouse Gas Emission Intensities of the Steel, Fertilisers, Aluminium and Cement Industries in the EU and Its Main Trading Partners. European Commission Joint Research Centre, EUR 31653 EN, JRC134682.
[34] U.S. Department of Commerce, Bureau of Industry and Security. Section 232 Investigations: The Effect of Imports on the National Security. Official agency description of the statutory investigative purpose.
[35] European Commission. (2026, July 23). Commission Implementing Decision (EU) 2026/1862 determining the uniform cross-sectoral correction factor for the adjustment of free allocations of emission allowances for the period 2026 to 2030, Article 1. Official Journal of the European Union, L 2026/1862, July 24, 2026.
[36] European Commission. (2024). Commission Implementing Regulation (EU) 2024/2522 amending Annex I to Regulation (EEC) No 2658/87: Combined Nomenclature for 2025. Official Journal of the European Union.
[37] European Commission. (2025). Commission Implementing Regulation (EU) 2025/1926 amending Annex I to Regulation (EEC) No 2658/87: Combined Nomenclature for 2026. Official Journal of the European Union.
[38] Spanish Tax Agency (Agencia Tributaria). (2026). Combined Nomenclature 2026: structure and correspondence of revised CN codes. Official correspondence-table distribution.
[39] European Parliament and Council. (2003, as amended). Directive 2003/87/EC establishing a system for greenhouse gas emission allowance trading within the Union. Official Journal.
[40] European Commission. (2019, as amended). Delegated Regulation (EU) 2019/331 determining transitional Union-wide rules for harmonised free allocation. Official Journal.
[41] European Commission. (2018, as amended). Implementing Regulation (EU) 2018/2066 on monitoring and reporting greenhouse gas emissions under Directive 2003/87/EC. Official Journal.
[42] European Commission. (2018, as amended). Implementing Regulation (EU) 2018/2067 on verification of data and accreditation of verifiers under Directive 2003/87/EC. Official Journal.
[43] European Commission. (2025). Commission Implementing Regulation (EU) 2025/2548 on calculation and publication of the price of CBAM certificates. Official Journal.
[44] European Commission. (2025). Commission Implementing Regulation (EU) 2025/2619 on information to be communicated by customs authorities for CBAM. Official Journal; legislation index.
[45] European Commission. (2025). Commission Implementing Regulation (EU) 2025/486 on the status of authorised CBAM declarant. Official Journal; legislation index.
[46] European Commission. (2025). Commission Implementing Regulation (EU) 2025/2549 amending the rules on authorised CBAM declarants. Official Journal; legislation index.
[47] Office of the United States Trade Representative. (2025). 2025 Trade Policy Agenda and 2024 Annual Report of the President on the Trade Agreements Program.
[48] United States Congress. 19 U.S.C. § 2414, Section 304 of the Trade Act of 1974: Determinations by the United States Trade Representative. Office of the Law Revision Counsel.
[49] World Trade Organization. (1994). Agreement on Technical Barriers to Trade, including Articles 1–6 and Annex 1. Official WTO legal text.
[50] U.S. Bureau of Labor Statistics. Employment Projections: Input-Output Data. U.S. Department of Labor.
[51] U.S. Bureau of Economic Analysis. Concepts and Methods of the U.S. Input-Output Accounts. U.S. Department of Commerce.
[52] U.S. Bureau of Economic Analysis. Input-Output Accounts: interactive tables, classification concordances and release documentation. U.S. Department of Commerce.
[53] Eurostat. (2026). International Trade in Goods: methodology and classifications. European Commission.
[54] Eurostat. (2026). Comext Database: DS-prefixed API access and technical user guide. European Commission.
[55] Eurostat. (2026). Comext detailed international trade in goods: database and bulk-download distributions. European Commission.
[56] U.S. Census Bureau. (2026). International Trade monthly datasets (2010–present), Harmonized System exports. U.S. Department of Commerce.
[57] U.S. Environmental Protection Agency. Greenhouse Gas Reporting Program: facility and subpart data sets.
[58] U.S. Environmental Protection Agency. GHGRP Subpart G: Ammonia Manufacturing, reporting rules and technical support.
[59] U.S. Environmental Protection Agency. GHGRP Subpart F: Aluminum Production, Hall–Héroult process reporting.
[60] U.S. Environmental Protection Agency. GHGRP Subpart Q: Iron and Steel Production, reporting categories.
[61] U.S. Environmental Protection Agency. GHGRP Subpart P: Hydrogen Production, reporting scope and technical support.
[62] U.S. Geological Survey. Iron and Steel Statistics and Information, National Minerals Information Center.
[63] U.S. Geological Survey. Aluminum Statistics and Information, National Minerals Information Center.
[64] U.S. Geological Survey. Nitrogen Statistics and Information, National Minerals Information Center.
[65] U.S. Geological Survey. Iron Ore Statistics and Information, National Minerals Information Center.
[66] International Energy Agency. (2020). Iron and Steel Technology Roadmap: Towards More Sustainable Steelmaking. IEA.
[67] World Steel Association. (2025). World Steel in Figures 2025, including 2024 production and production-route statistics.
[68] U.S. Department of Energy. (2022). Industrial Decarbonization Roadmap.
[69] International Energy Agency. (2019). The Future of Hydrogen: Seizing Today’s Opportunities.
[70] U.S. Energy Information Administration. (2026). Electric Power Annual: Table 2.10, Average Price of Electricity by State and End-Use Sector, 2025 and 2024.
[71] U.S. Energy Information Administration. (2026). Electric Power Monthly: Table 5.6.A, Industrial Electricity Prices by State, August 2026 and 2025.
[72] Siemens Energy. SGT-400 Industrial Gas Turbine: product technical specifications.
[73] CBMM / Niobium Technology. Niobium: Future Possibilities, Technology and the Marketplace, original technical compendium.
[74] European Commission, Directorate-General for Taxation and Customs Union. (2026). CBAM Legislation and Guidance: definitive-period implementation and sector guidance documents.
[75] European Commission, Directorate-General for Taxation and Customs Union. (2026). CBAM Questions and Answers, edition October 15, 2026.
[76] European Commission, Directorate-General for Climate Action. (2026). Allocation to Industrial Installations: 2026–2030 benchmarks and national allocation decisions.
[77] European Commission, Directorate-General for Taxation and Customs Union. (2026, August 24). Guidance on CBAM verification and accreditation for verifiers and National Accreditation Bodies. Official guidance publication notice with link to the Commission guidance document.
[78] U.S. Bureau of Economic Analysis. (2026). U.S. International Economic Accounts: Concepts and Methods, June 2026 edition.
[79] U.S. Department of Commerce / United States Congress. 19 U.S.C. § 1862, Safeguarding National Security (Trade Expansion Act Section 232).
[80] European Commission. (2026, June 15). Commission Decision (EU) 2026/1312 concerning national implementation measures for transitional free allocation of greenhouse gas emission allowances for 2026–2030 under Article 11(3) of Directive 2003/87/EC. Official Journal of the European Union, L 2026/1312, June 17.
[81] European Commission. (2025, December 17). SWD(2025) 988 final: Impact Assessment Report accompanying COM(2025) 989 final, Part 1/2, especially Sections 5–8, Table 5, Table 6 and footnote 69. Original legislative impact assessment.
[82] European Commission. (2025, December 17). SWD(2025) 989 final: Executive Summary of the Impact Assessment Report accompanying COM(2025) 989 final.
[83] European Commission. (2025, December 16). COM(2025) 783 final: Report from the Commission to the European Parliament and the Council on the application of the Regulation on the Carbon Border Adjustment Mechanism, particularly Section 5.
[84] Eurostat. (2026). EU inter-country supply, use and input-output tables (FIGARO), 2026 edition: statistical metadata, time coverage, industry classification and pricing convention. European Commission, dataset naio_10_fcp.
[85] European Commission. (2025, December 17). SWD(2025) 988 final: Impact Assessment Report accompanying COM(2025) 989 final, Part 2/2, Annex 4.2 (downstream carbon-leakage product selection), Tables 3–4 and Annex 7. European Commission text, public consultation archival copy.
[86] Eurostat. (2026, July 20). EU inter-country input-output table at basic prices, industry by industry (2022 and onwards), dataset naio_10_fcp_ii4, FIGARO 2026 release. Official EU Open Data Portal dataset record and DOI.
[87] Trinomics. (2025). Study on the CBAM scope extension to downstream products. European Commission commissioned study, implementation May 2024 to September 2025, with Technopolis Germany, Environment Agency Austria and Intellera Consulting. Original contractor project disclosure.
[88] Eurostat. (2026). EU production and international trade in industrial products (PRODCOM), dataset DS-059358: public product-level industrial production and trade data underlying part of the 2016–2023 product screen.
[89] European Commission. (2025, December 17). COM(2025) 989 final, Annexes 1 to 3 to the proposed amendment of Regulation (EU) 2023/956, Annex I including ex-9018 90 84 and conditional metal goods descriptions. Official legislative annex.
[90] European Commission, Directorate-General for Taxation and Customs Union. (2026). Price of CBAM certificates: quarterly prices and the 2026 methodology, official price-publication page. Q1: €75.36 (7 April 2026); Q2: €75.28 (6 July 2026); Q3: €82.32 (5 October 2026).
[91] Environmental Protection Agency (Ireland). (2026). CBAM Certificates, official national competent-authority guidance, “CBAM Certificate Price” section. The published table independently records the European Commission’s 2026 Q1, Q2 and Q3 certificate prices, €75.36, €75.28 and €82.32, with dates of publication.
Authors

Alex is the founder of the Terawatt Times Institute, developing cognitive-structural frameworks for AI, energy transitions, and societal change. His work examines how emerging technologies reshape political behavior and civilizational stability.

U.S. energy strategist focused on the intersection of clean power, AI grid forecasting, and market economics. Ethan K. Marlow analyzes infrastructure stress points and the race toward 2050 decarbonization scenarios at the Terawatt Times Institute.

Preston studies the policy and social dimensions of the energy transition, focusing on urban electrification, energy equity, and how emerging technologies shape outcomes for middle‑ and working‑class communities.