CBAM Country Intelligence Oman 2026: Absent Country Entries, Remedy Without Procedure, Pre-Sold Exposure
Omani urea faces €140.6 per tonne under CBAM; Egyptian urea faces €39.5. Both come from steam methane reforming of gas. Egypt holds an Annex I entry and Oman does not. Volume 31 quantifies the cost of that absence, and finds no procedure by which a country may ask to be listed.

Executive Summary
Scope. This report covers the exposure of Omani production to the European Union's Carbon Border Adjustment Mechanism in its definitive period, which began on 1 January 2026. It examines every Omani installation producing a CBAM good or a CBAM precursor, together with the announced pipeline through 2029. All regulatory values are taken from Annex I to Implementing Regulation (EU) 2025/2621 as replaced in full by Implementing Regulation (EU) 2026/1740, and all benchmarks from Implementing Regulation (EU) 2025/2620. Data are current to 15 August 2026.
Core finding. The carbon cost a shipment faces at the European border is determined principally by whether its country of origin holds an entry for that product in Annex I, and only secondarily by how the product was made. Omani urea, produced by steam methane reforming of pipeline gas, faces a 2026 default-value charge of €140.6 per tonne. Egyptian urea, produced by the same route, faces €39.5. Egypt has a country entry for urea. Oman does not.
Quantified results. Three comparisons between origins using the same production technology, computed on the 2026 parameter set at a certificate price of €75.28 per tonne of CO₂ equivalent:
| Product | Listed comparator | Oman (fallback) | Ratio |
|---|---|---|---|
| Urea, CN 3102 10 19 | Egypt €39.5/t | €140.6/t | 3.6× |
| Anhydrous ammonia, CN 2814 10 00 | Egypt €44.2/t | €126.3/t | 2.9× |
| Direct reduced iron, CN 7203 | United States €8.1/t | €80.6/t | 9.9× |
The calculation reproduces the published Q1 2026 market charge on Egyptian urea of €39.52 per tonne to the cent, from first principles.
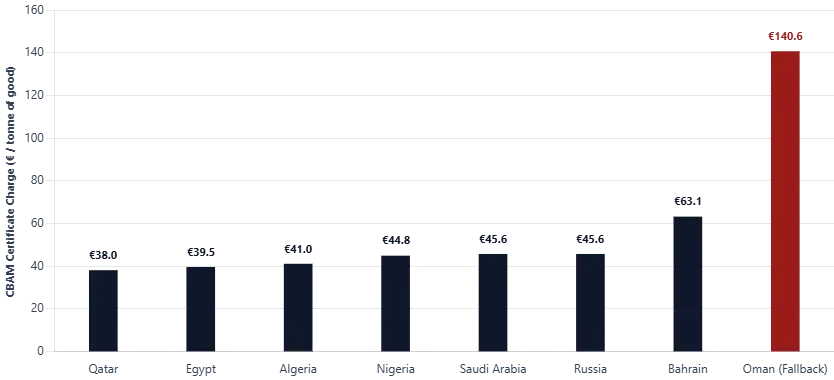
Figure 1: Same-technology comparison of 2026 default-value charges. Each pair sets an origin holding a country entry against Oman, which takes the Other Countries fallback for the same product made by the same production route. Certificate price €75.28 per tonne of CO₂ equivalent. Sources: [1][2][3].
How the table is built. Annex I names 121 countries. Eighty-nine of them, or 73.6 per cent, carry values in at least one sector and nothing at all in at least one other. Iron and steel is where absence concentrates: 70 of the 121 have no entry. For CN 7203, the heading covering direct reduced iron and hot briquetted iron, exactly eight named countries in the world hold a value, and the entire gas-based direct reduction industry outside the Americas is absent. Aluminium is treated differently again: sixty-eight countries share nine values, and three of those nine cover sixty-two countries. Oman's aluminium figure of 1.700 is shared with eighteen other states whose smelters run on hydropower, gas, coal and nuclear alike.
The dominant lever. For Omani products, movement in the annex is worth more than movement in the plant. Oman's aluminium entry already sits where the smelter sits, so verified declaration returns only the mark-up, worth €14.3 per tonne in 2026 and €39.9 from 2028. For the three unlisted products the gap is structural, and Section 4.6 estimates what a calibrated Omani entry would contain, using engineering reconstruction for aluminium, verified Gulf declarations for iron, and disclosed site data for nitrogen.
| Product | Value applied today | Basis | Calibrated estimate | Excess |
|---|---|---|---|---|
| Unwrought aluminium, CN 7601 | 1.700 | Country entry | 1.65 to 1.72 | none |
| Direct reduced iron, CN 7203 | 1.325 | Fallback | 0.50 to 0.80 | 66% to 165% |
| Anhydrous ammonia, CN 2814 10 00 | 3.130 | Fallback | approx. 2.4 | approx. 30% |
| Urea, CN 3102 10 19 | 2.720 | Fallback | 1.35 to 1.50 | 81% to 101% |
Values in tonnes of CO₂ equivalent per tonne of good, before mark-up. Direct reduced iron estimates are on the direct-emission basis and carry the sensitivity range described in Section 4.8.
Trade position. Present European exposure is small and concentrated. Unwrought aluminium accounted for 110,890 tonnes and US$298 million in 2024, with Italy and Greece taking roughly 78 per cent. Steel, pellets, cement and hydrogen are marginal or absent. Urea reached 162,990 tonnes in 2025 during a stocking surge ahead of the definitive regime. Future exposure is a different order: 12.5 million tonnes a year of direct reduced iron and hot briquetted iron capacity is under development at Duqm, of which 1.25 million tonnes a year has been allocated to named European buyers for delivery from 2029.
Sequence. Verifiers could not register in the CBAM Registry before 1 September 2026, and the first accreditations were expected that month. The first annual declaration falls due on 30 September 2027. The default values must be revised by December 2027 at the latest. The Duqm volume arrives in 2029. Both routes to a lower charge, national listing and verified declaration, close before the exposure that would justify pursuing them appears. The national realisable value of verified declaration today is approximately €1.6 million a year; from 2029 it is between €66 million and €95 million.
Caveats carried throughout. Emission factors for hot briquetted iron rest on supplier design values on the direct-emission basis and on two verified declarations on a cradle-to-gate basis; every figure derived from them is presented as a range. The ammonia and urea intensities are derived from disclosed site aggregates rather than metered train-level data. The binding status of the Duqm offtake allocations is not on the public record.
Remaining content is for paid members only.
Please subscribe to any paid plan to unlock this article and more content.
Subscribe Now