Beyond Citation Counts: Measuring Policy Influence Through Evidence, Observation, and Decision Relevance
Policy influence is often read from citation counts. Drawing on diabetes guidelines, a NICE evidence review and GAO audit reports, this article shows where records and real use diverge, bounds what incomplete archives can reveal, and ties further evidence to the decision at hand.

Abstract
Citation counts and documentary references are widely available measures of the relationship between research and policy. Their interpretation depends on what a record captures, how it entered an accessible archive, and which substantive claim the analyst intends to evaluate. This article develops a task-specific approach to policy influence measurement by combining research-utilization theory, causal reasoning, observation models, partial identification, and decision-relevant evidence selection. It synthesizes published research on clinical guidelines with documentary exercises based on a NICE evidence review and two sets of U.S. Government Accountability Office (GAO) reports. A study of diabetes clinical guidelines identified formal citations in 116 of 585 textually credited article–guideline pairs in one sample and 190 of 2,560 in another. A 2019 NICE hypertension evidence review shows why a publication's appearance in a report and its inclusion for a specified review question require separate classifications. In ten selected 2026 U.S. Government Accountability Office reports, agencies implemented 18 priority recommendations although their combined outstanding stock declined by only two. A stock-change proxy misestimated implementation in six agencies but changed only one decision under an illustrative 25% review threshold. We also derive a conditional identification interval for an explicitly hypothetical observation model, showing how incomplete archive coverage and detector error constrain population inferences. Together, these examples establish a practical requirement: specify the target relationship and observation process before estimating influence, then acquire further evidence according to its expected value for the decision at hand. These exercises establish identifiable measurement and decision problems, while comparative performance against established professional methods remains an empirical question.
Keywords: policy influence measurement; policy impact measurement; research utilization; evidence-informed policymaking; observation mechanisms; partial identification; misclassification; value of information
1. Introduction
In ten U.S. federal agencies examined in 2026, eighteen priority audit recommendations were implemented, while the combined outstanding stock fell by only two [17–26]. In clinical guideline research, a paper may receive a formal citation without being credited in the substantive text, or receive textual credit without a formal citation [11]. The records answer well-defined questions. Problems arise when their counts are used to answer questions about substantive use, causal contribution, or completed action.
The difficulty extends well beyond citations. Policy influence can involve research entering an official document, an idea shaping how a problem is defined, an agency changing its procedures, or a regulation altering behavior. Each event occupies a particular place in the policy process. The evidence that establishes its occurrence differs from the evidence needed to attribute it to a particular source, estimate its net effect, or determine its public value. OECD work on policy evaluation and knowledge mobilization recognizes the institutional conditions that govern whether evidence enters decisions and how its use can be evaluated [1–3].
A useful policy impact measurement system begins with a defined question: What has been observed, about which object, at what time, and for which decision? This article develops a practical answer by connecting established research on knowledge utilization and policy processes with observation models, partial identification, and task-specific decisions about further evidence. Three documentary exercises illustrate these distinctions. The NICE review tests whether a publication's appearance in a report establishes its inclusion for a specified evidence question. A ten-agency GAO comparison tests whether reductions in outstanding recommendations measure actual implementation. A separate six-agency GAO exercise examines how additional administrative fields narrow the feasible range of implementation counts. The analysis combines established theory with public primary documents. Their calculations use cited administrative counts or explicitly hypothetical parameters. Their role is diagnostic: they show what different records identify and where additional information becomes necessary.
2. Defining the Policy Influence Claim
The term policy influence covers several related propositions. To examine one, an analyst first specifies a knowledge object, a particular research finding, dataset, model, or recommendation in an identifiable version. The analyst then specifies a policy unit, such as a ministry's decision, a paragraph in a consultation document, a clinical guideline's evidence-review question, or a formal implementation action. Finally, the analyst states a target predicate, the relationship to be assessed between the source and the policy unit. A predicate specifies the property that would make the claim true. “This report was cited” and “this report changed the final decision” are different predicates, even when they concern the same document.
Several relationships need distinct evidentiary tests. A citation trace is an observable reference in a document. Documented use means that the available record shows research being considered, applied, evaluated, or incorporated in a specified process. Causal contribution along a path concerns whether the research participated in a credible sequence leading to an action or outcome. A source-specific net effect asks how the outcome would differ under an explicitly defined alternative in which that source's contribution was absent or changed. The last question requires a comparison, a causal model, or another defensible identification strategy. Direct observation of a citation answers the first question immediately; the others usually require additional information.
Research-utilization scholarship offers several explanations for how influence develops. Carol Weiss described multiple forms of research utilization, including forms that unfold through the gradual diffusion of concepts rather than an immediate decision [4]. John Kingdon's analysis of agendas and policy alternatives helps explain why an available idea may become consequential during a particular policy window [5]. Peter Haas examined the role of expert knowledge networks in shaping how states understand technically complex problems [6], while Paul Sabatier connected policy-oriented learning to advocacy coalitions and longer periods of institutional change [7]. Steven Lukes' analysis of power broadens attention to agenda control and the decisions that never reach an overt vote [8]. These mechanisms operate at different times and leave different traces. Which one matters depends on the policy event and the claim under examination.
Causal assessment has equally useful existing tools. Process tracing examines diagnostic evidence within a sequence of events and evaluates competing explanations [9]. Contribution analysis tests whether an intervention plausibly contributed to observed outcomes alongside other influencing conditions [10]. A framework for policy influence measurement can draw on both while retaining the identity of the object being measured. For example, two ministries might adopt identical language because both used the same earlier technical standard. The textual match provides evidence of similarity, but it cannot allocate the outcome to one later report without tracing the common source and the ministries' separate decisions. Nor does a documented use of a study establish that the same policy would have been impossible without it.
Table 1. What different records can establish
| Observable record | Directly supported conclusion | Additional question requiring evidence |
|---|---|---|
| Formal bibliographic citation | A specified document refers to a research object | Was the finding substantively considered or applied? |
| Relevant text or evidence-table entry | The research has a defined textual or review-process relationship | What role did it play in the decision? |
| Committee discussion and recorded action | A proposition was examined, accepted, modified, or acted upon as recorded | Which source was causally important? |
| Implemented policy or verified outcome | A specified administrative or real-world event occurred | What change is attributable to the research, and with what public value? |
The relationships can occur in different orders or in parallel. Research may affect agenda formation without ever receiving a formal citation. A statute may change a legal right immediately, while the behavioral response develops years later. The proposition, policy unit, and observation date determine the evidence needed.
3. The Observation Problem: Archives, Selection, and Misclassification
A policy archive is produced by institutions, document practices, disclosure rules, and retrieval technologies. It captures only part of the activity relevant to a research question. A formal evidence table will record different relationships from a bibliography; a public consultation repository will preserve different stages of decision-making from a final regulation. Even within one policy document, a researcher may be cited, discussed, included in a quantitative synthesis, or mentioned only in an exclusion list. Each channel produces a different observable trace.
Comparisons of research-to-policy impact across organizations and countries are especially sensitive to such recording differences. Imagine two otherwise similar research findings considered by different agencies. One agency publishes detailed evidence assessments, while the other reports only final decisions. A citation search may yield a striking disparity even if the underlying deliberations are similar. Automated extraction adds a further layer of missed references, false matches, and variations in textual similarity. Before translating a count into an influence rate, the analyst needs to know which objects could have entered the archive, which were represented in accessible records, and how the detection procedure behaves within that frame. OECD studies of education research intermediaries and evidence-informed policymaking ecosystems illustrate why the institutional organization of evidence use and recordkeeping matters [2,3].
A 2026 study by Andreas Distel, Christoph Grimpe, and Marion Poetz reports the joint distribution of formal citation and textual credit. The authors analyzed relationships between scientific papers and diabetes clinical practice guidelines using an approach that compared formal citations with textual credit, including matches detected through natural language processing [11]. Their Appendix 10 distinguishes four categories: citation with textual credit, formal citation without textual credit (a token citation), textual credit without formal citation (a hidden citation), and no observed link. These are classifications generated under the study's particular corpus and matching threshold. They permit a precise comparison of visibility channels.
In the main sample, 585 article–guideline pairs received textual credit, of which 116 also had formal citations: 116/585 = 19.8%. The corresponding conditional proportion in the out-of-sample data was 190/2,560 = 7.4%. The full datasets contained 1,302 and 7,864 pairs, respectively [11, Appendix 10, p. 29]. Each numerator counts pairs with both textual credit and a formal citation; each denominator counts all pairs with textual credit under the authors' matching method. The main dataset included 81 papers that had been cited at least once in one of 21 clinical practice guidelines, while the out-of-sample analysis drew from a broader diabetes-journal corpus without that citation requirement [11, §3.1 and Appendix 10]. The initial sampling rule raises the opportunity to observe formal citations. Accordingly, the contrast between 19.8% and 7.4% reflects differences in sample selection and document relationships, and supplies two conditional proportions under distinct sampling frames.
These sampling and recording differences alter the interpretation of a citation count. Where textual credit is part of the target concept, counting only bibliographic links will miss many relationships recognized by the study's text-matching method. Conversely, treating every formal citation as substantive uptake ignores the token-citation category. Distel and colleagues also relate their categories to expert judgments and describe institutional reasons for different citation practices [11]. Their study gives policy impact measurement a concrete empirical reason to model the production of evidence traces rather than equating their availability with the underlying phenomenon.
Versioning adds another source of error. At minimum, analysts should separate the date a research result became available, its formal publication date, the policy document's original drafting or decision date, the date of any later revision, and the date an archive indexed the record. A policy text that appears to predate a published paper might have used a preprint; the policy file might have been revised later; or one of the database dates might be incomplete. The direction of possible influence depends on the actual sequence. A date mismatch is a reason to reconstruct the versions before drawing a causal conclusion.
Conceptually, the observation process contains two distinct steps. A target relationship, such as the defined use of a research finding, may or may not be represented in an accessible archival frame; a search procedure may then detect or miss it. Both stages can be studied quantitatively, and Figure 1 summarizes their structure. The next section shows what can still be learned when neither stage is perfectly observed.
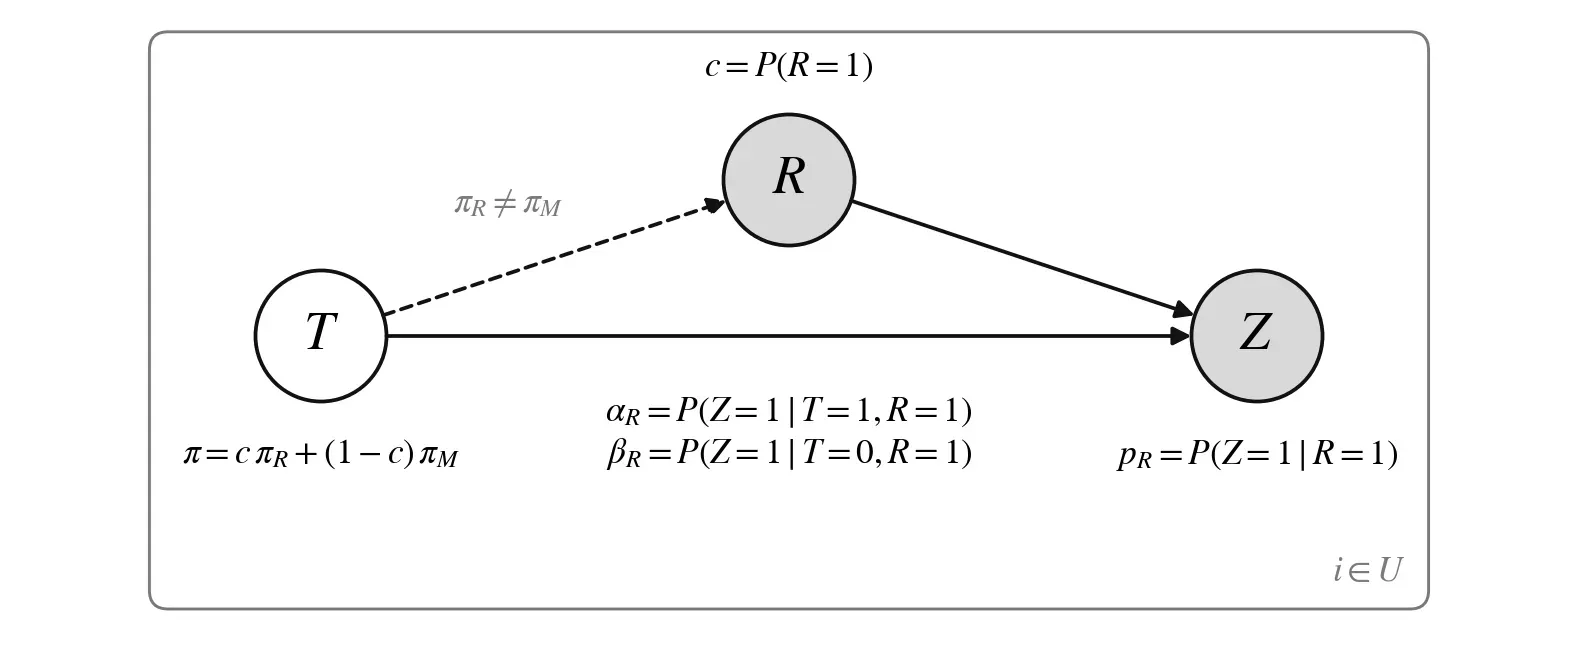
Figure 1. Observation structure for a defined research-use relationship. T is the latent target relationship, R indicates representation in the accessible archive, and Z is the detected trace. Shaded nodes are observed. The dashed arrow indicates that archive selection may depend on T, so that π~R~ and π~M~ can differ. The frame denotes repetition over research–policy pairs i ∈ U. Equations (1)–(5) combine the archived and unrepresented parts of the population.
4. Partial Identification Under Archive Selection and Detection Error
Consider a fixed population U of research-object–policy-unit pairs during a defined period. For each pair, let T = 1 mean that the target relationship occurred under a predetermined definition of substantive use, and T = 0 mean that it did not. Let R = 1 indicate that the pair is represented in the archive accessible to the analyst. Finally, Z = 1 means that a chosen detection procedure reports a positive trace. These are three distinct binary variables: the underlying target, inclusion in the observation frame, and the measured signal.
The overall target-use rate is π = P(T = 1), where P denotes probability across the specified population U. Let c = P(R = 1) be archive coverage, π_R = P(T = 1 | R = 1) the target rate among covered pairs, and π_M = P(T = 1 | R = 0) the corresponding rate among missing pairs. The law of total probability gives:
π = cπ~R~ + (1 − c)π~M~. (1)
Coverage therefore matters even if classification among observed records is excellent. If the missing pairs differ systematically from those represented in the archive, an observed-subset estimate may differ from the population rate.
Now define α_R = P(Z = 1 | T = 1,R = 1), the detection procedure's sensitivity or true-positive probability among covered pairs; β_R = P(Z = 1 | T = 0,R = 1), its false-positive probability among covered pairs; and p_R = P(Z = 1 | R = 1), the positive-trace fraction that the analyst actually observes. The measurement relation is:
p~R~ = α~R~π~R~ + β~R~(1 − π~R~). (2)
This measurement relation has the same algebraic structure as the prevalence adjustment derived by Rogan and Gladen for imperfect screening tests [14]. When α_R exceeds β_R and the assumed values are jointly compatible with the observed p_R, the target rate within the archive can be recovered conditionally as:
π~R~ = (p~R~ − β~R~) / (α~R~ − β~R~). (3)
The observed positive fraction combines true detections among pairs with the target relationship and false detections among other pairs. Here the screening procedure is documentary, and the underlying condition is a specified research-use relationship. When sensitivity and false-positive rates are known only within constrained ranges, the corresponding identification region follows the general misclassification approach studied by Molinari [15]. Calibration requires validation data from an appropriate policy-document setting or explicitly stated sensitivity assumptions.
For transparency, take a purely hypothetical illustration. Suppose archival coverage is c = 0.70, the observed positive-trace fraction is p_R = 0.20, sensitivity is somewhere in [0.50, 0.90], and the false-positive rate lies in [0, 0.10]. Assume the parameter combinations in these intervals are jointly feasible and no further dependence constraints narrow the set. Equation (3) then yields:
π~R~ ∈ [(0.20 − 0.10)/(0.90 − 0.10), (0.20 − 0)/(0.50 − 0)] = [0.125, 0.400]. (4)
Without a justified assumption about the uncovered 30% of pairs, π_M can range from 0 to 1. Substituting those extremes into Equation (1) gives:
π ∈ [0.70(0.125), 0.70(0.400) + 0.30] = [0.0875, 0.58]. (5)
Thus, the same hypothetical observed positive fraction of 20% is consistent with an overall target-use fraction between 8.75% and 58%, under the stated calibration ranges and selection assumptions. The width of the interval tells the analyst how much remains unidentified. The bounds assume a fixed population of research–policy pairs, jointly attainable parameter limits, known coverage, and no additional restrictions on the target-use rate among missing records. The numerical inputs are hypothetical values chosen to demonstrate the calculation. Figure 2 displays the identified set for π~R~ and the resulting population interval.
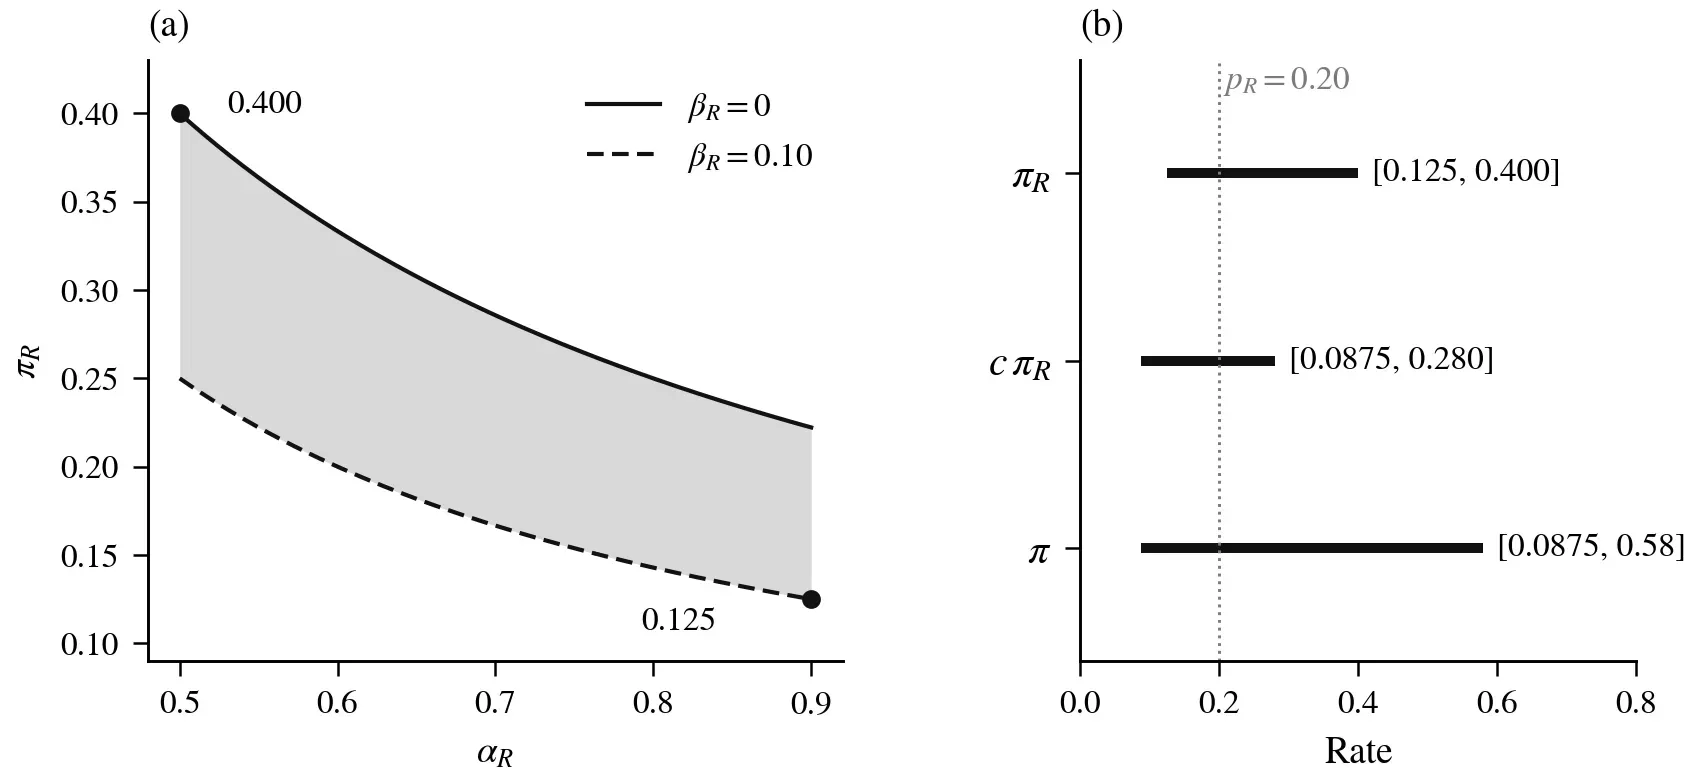
Figure 2. Identified sets under hypothetical calibration ranges. (a) The target-use rate among archived pairs, π~R~, as a function of sensitivity α~R~ for the two limiting false-positive rates; the shaded region is the identified set, with extreme points 0.125 and 0.400. (b) Intervals for π~R~, its archived component cπ~R~, and the population rate π after allowing π~M~ to range from 0 to 1, with c = 0.70 and observed p~R~ = 0.20.
The population-coverage component draws on partial-identification work concerning incomplete observations [13], while Equations (2) and (3) follow diagnostic misclassification correction [14] and the interval analysis draws on restricted misclassification models [15]. Its practical contribution is to make the target population, measurement process, and assumptions visible together. Stronger external calibration might tighten the interval; a representative sample of currently missing records might constrain π_M; a different target definition could change the entire question. When no such evidence is available, the interval is the appropriate result. For some decisions it may already be sufficiently informative. For others, it identifies which evidence should be obtained next.
5. Case Study A: Research Inclusion in a NICE Evidence Review
The United Kingdom's National Institute for Health and Care Excellence (NICE) publishes the records needed to distinguish a study's appearance in an evidence review from its inclusion for a particular clinical question. Its 2019 Evidence Review A, supporting guideline NG136 on hypertension diagnosis and management, compares the diagnostic accuracy of blood-pressure measurement methods using ambulatory blood-pressure monitoring as the reference standard [12]. The review provides question-specific eligibility criteria, clinical evidence tables, and excluded-study lists.
Consider a fixed, purposively selected set of eight publications identifiable in that 2019 review. Four, by den Hond (2003), Gerc (2000), Gill (2017), and Mansoor (2004), appear among the studies included for the specified diagnostic-accuracy review and its clinical evidence tables. Four others, by Bjorklund (2004), Bobrie (2004), Dawes (2006), and Hodgkinson (2011), appear in Appendix I.1 (“Excluded clinical studies,” pp. 99–104), Table 24 (previously included under CG127, excluded in the update) and Table 25 (full clinical exclusions) [12]. NICE identifies the first three as prognostic-outcome studies that did not meet the diagnostic-accuracy study-design requirement. Hodgkinson is listed as a systematic review whose references were checked [12, Appendix I.1, Tables 24–25]. Because all eight publications are mentioned somewhere in the full evidence-review document, an indiscriminate “appears in the PDF” rule identifies all eight as positive. Relative to inclusion for this diagnostic-accuracy question, it therefore produces four true positives and four false positives. A rule asking whether a publication is represented in the corresponding clinical evidence tables classifies the same selected set as four included and four excluded.
Table 2. A reproducible eight-publication comparison in NICE's 2019 Evidence Review A
| Publication identified by first author and year | Full-review mention | Included in the specified clinical evidence tables | Primary source locator |
|---|---|---|---|
| den Hond, 2003 | Yes | Yes | Table 3; Appendix D |
| Gerc, 2000 | Yes | Yes | Table 3; Appendix D |
| Gill, 2017 | Yes | Yes | Table 3; Appendix D |
| Mansoor, 2004 | Yes | Yes | Table 3; Appendix D |
| Bjorklund, 2004 | Yes | No | Appendix I.1, Tables 24–25; prognostic outcomes |
| Bobrie, 2004 | Yes | No | Appendix I.1, Tables 24–25; prognostic outcomes |
| Dawes, 2006 | Yes | No | Appendix I.1, Tables 24–25; prognostic outcomes |
| Hodgkinson, 2011 | Yes | No | Appendix I.1, Tables 24–25; systematic review, references checked |
Source: National Guideline Centre/NICE, Evidence Review A, August 2019 [12]. “Included” is defined solely by the diagnostic-accuracy question and the corresponding clinical evidence tables. The balanced, purposively selected sample illustrates how the choice of documentary channel changes classification.
The classification changes with the review question. A publication in an exclusion appendix was considered by a review process sufficiently to be documented, yet it did not become an included study for the particular diagnostic-accuracy synthesis. That exclusion does not erase every other possible relationship between the publication and the guideline. A review might consult background literature, evaluate a finding in a different question, or use an earlier synthesis in an economic model. The correct description depends on the predicate and its unit of analysis.
The eight-study comparison raises an evaluation-design issue. NICE's official inclusion labels and its clinical evidence tables are outputs of the same institutional review process. Close agreement between them demonstrates the coherence of that particular documentary classification. It does not measure how an independently designed research-use classifier performs against external ground truth. A separate validation exercise would require independently coded cases, an appropriate sampling frame, and reference judgments that do not simply reuse the field being tested. What the public case establishes directly is that the observation channel can change the apparent answer to a defined review question.
6. Case Study B: GAO Recommendations and Decision Errors
Measurement problems recur even when the object is administrative action rather than research use. The U.S. Government Accountability Office (GAO) publishes agency-specific reports on priority open recommendations, a subset of recommendations that GAO considers particularly important for federal management and oversight. In these reports, the number outstanding at the beginning of an observation window can change because recommendations are implemented, new ones receive priority status, or existing items lose that designation. GAO's official reports separately identify implementation in the cases examined here [17–26]. Earlier GAO reporting also documents recommendations that left the priority-open stock when GAO closed them without implementation [16].
A comparison of ten preselected 2026 agency reports illustrates the risk of using the change in outstanding stock as a proxy for implementation. The reports cover different agency-specific windows, generally beginning in 2025 and ending during 2026. Their counts describe the named agency's priority recommendations.
Table 3. Official GAO priority-recommendation counts, agency-specific 2025–2026 windows
| Agency | Opening stock | GAO-reported implemented | Closing stock | GAO source |
|---|---|---|---|---|
| Agriculture (USDA) | 5 | 2 | 6 | [17] |
| Commerce | 8 | 1 | 8 | [18] |
| Justice | 17 | 3 | 18 | [19] |
| Interior | 14 | 1 | 14 | [20] |
| Treasury | 32 | 4 | 28 | [21] |
| Education | 8 | 1 | 10 | [22] |
| Veterans Affairs | 29 | 2 | 30 | [23] |
| Environmental Protection Agency | 9 | 1 | 8 | [24] |
| Social Security Administration | 3 | 0 | 4 | [25] |
| Small Business Administration | 17 | 3 | 14 | [26] |
| Total across these reports | 142 | 18 | 140 | [17–26] |
Across these reports, the outstanding stock fell by two recommendations while GAO recorded eighteen implementations. Let B and E denote the opening and closing priority stocks, and I the GAO-reported number implemented. The stock-change proxy Î = max(B − E, 0), with the hat denoting an estimate of I, returns an incorrect implementation number in six of the ten agencies. For Agriculture, the opening stock of five became six despite two implemented recommendations and three new priority recommendations [17]. In Justice, seventeen became eighteen even after three implementations, because four recommendations were added [19]. The proxy conflates implementation with additions and nonimplementation exits from the outstanding stock.
How consequential is the numerical error? To explore that question, define a deliberately simple research decision: flag an agency for additional implementation review when its implemented recommendations divided by opening priority stock is below 25%. The 25% cutoff is a hypothetical analytical threshold chosen to compare resulting decisions. Under that rule, the incorrect stock-change proxy changes the flag in only one of the ten cases, Agriculture. Its actual implementation ratio is 2/5 = 40%, whereas the proxy reports zero. In the other nine cases, a flawed count still produces the same binary decision as the actual GAO implementation count. Figure 3 plots the reported and proxy ratios for all ten agencies against this threshold.
A constant-action baseline supplies an additional comparison. Flagging all ten agencies would also classify nine of ten correctly under this particular threshold, since nine agencies fall below 25%. The proxy's nine correct classifications therefore add no accuracy over this trivial constant-action baseline. Factual error, altered decisions, and decision loss must therefore be reported separately.
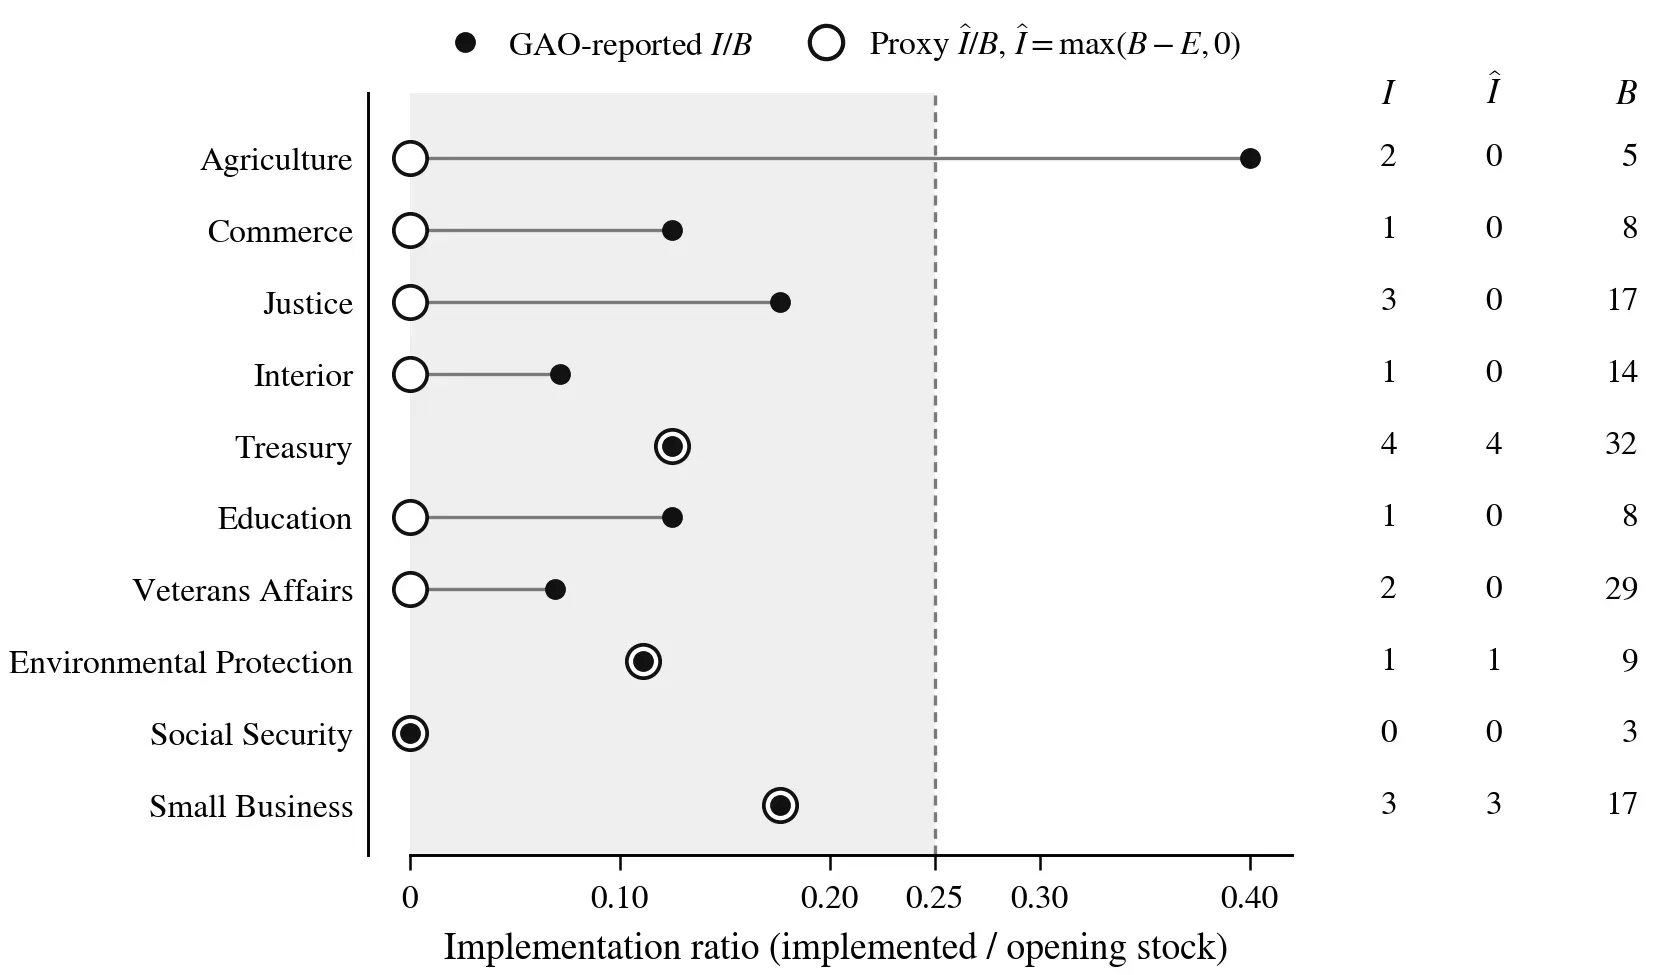
Figure 3. GAO-reported and stock-change proxy implementation ratios for ten agencies. Filled markers show GAO-reported ratios I/B; open markers show proxy ratios Î/B, with Î = max(B − E, 0). The shaded area marks ratios below the illustrative 25% review threshold. Concentric markers indicate agencies where the proxy equals the reported count. Columns at right list I, Î and B from Table 3.
The simplest accurate solution in these ten reports is to read the implemented number that GAO already provides. There is no analytical advantage in reconstructing it from incomplete stock flows. This is an example of appropriate professional sufficiency: when a directly relevant authoritative result exists and its definition fits the task, use it. Other questions, such as whether priority status was removed for substantive or administrative reasons, require additional fields and perhaps different sources. The GAO example concerns administrative implementation; causal effects of scientific research on agency decisions require a different target and source-level evidence.
7. Evidence Acquisition, Task Sufficiency, and Stopping
The preceding cases suggest a practical standard for evidence-informed policymaking: additional research should have a clearly stated purpose. The analyst needs to know which decision or inference might change, what new information could resolve the uncertainty, and whether acquiring that information is worth the effort. Three questions guide the work: What important conclusion remains sensitive to missing facts? Which obtainable source can distinguish the leading explanations? When is the current evidence sufficient for the stated task?
For a second example, consider six GAO agency reports covering State, the Office of Personnel Management, NASA, Housing and Urban Development, the Office of the Director of National Intelligence, and Transportation [27–32]. Let B be the opening number of priority-open recommendations and E the closing number. Define I as opening-cohort recommendations implemented during the observation window, D as opening-cohort recommendations leaving the priority-open list without implementation, and N as newly designated recommendations still outstanding at the end. The composite D includes removal of priority designation and closure as not implemented, two empirically distinct exit events; GAO's earlier NASA letter documents the latter [16]. The following identity applies when the opening cohort and the ending outstanding additions are tracked without double counting and these statuses exhaust all stock changes:
E = B − I − D + N. (6)
The exercise imposes 0 ≤ I ≤ B and nonnegative D and N, with no additional restriction on unknown additions before they are observed. Under those constraints, the beginning and ending stocks alone permit I to range from zero to B for each agency. The sum of feasible-interval widths therefore equals the six agencies' combined opening stock, 13 + 14 + 3 + 9 + 14 + 21 = 74; this baseline width is an algebraic consequence of the assumptions. Once the reported additions N are supplied, the upper bound for each agency becomes min(B, B + N − E). Across the six cases the widths become 8, 6, 0, 1, 9 and 5, summing to 29. Providing both N and the composite nonimplementation exits D identifies I = B − D + N − E in each case, reducing total interval width to zero [27–32]. Figure 4 shows this narrowing agency by agency. In these six published flow summaries, the positive D counts correspond to priority-status removals; the historical closure-without-implementation example [16] establishes why the general definition must cover that additional route. These are deterministic feasible intervals, and GAO's directly reported implementation counts remain the primary reference results.
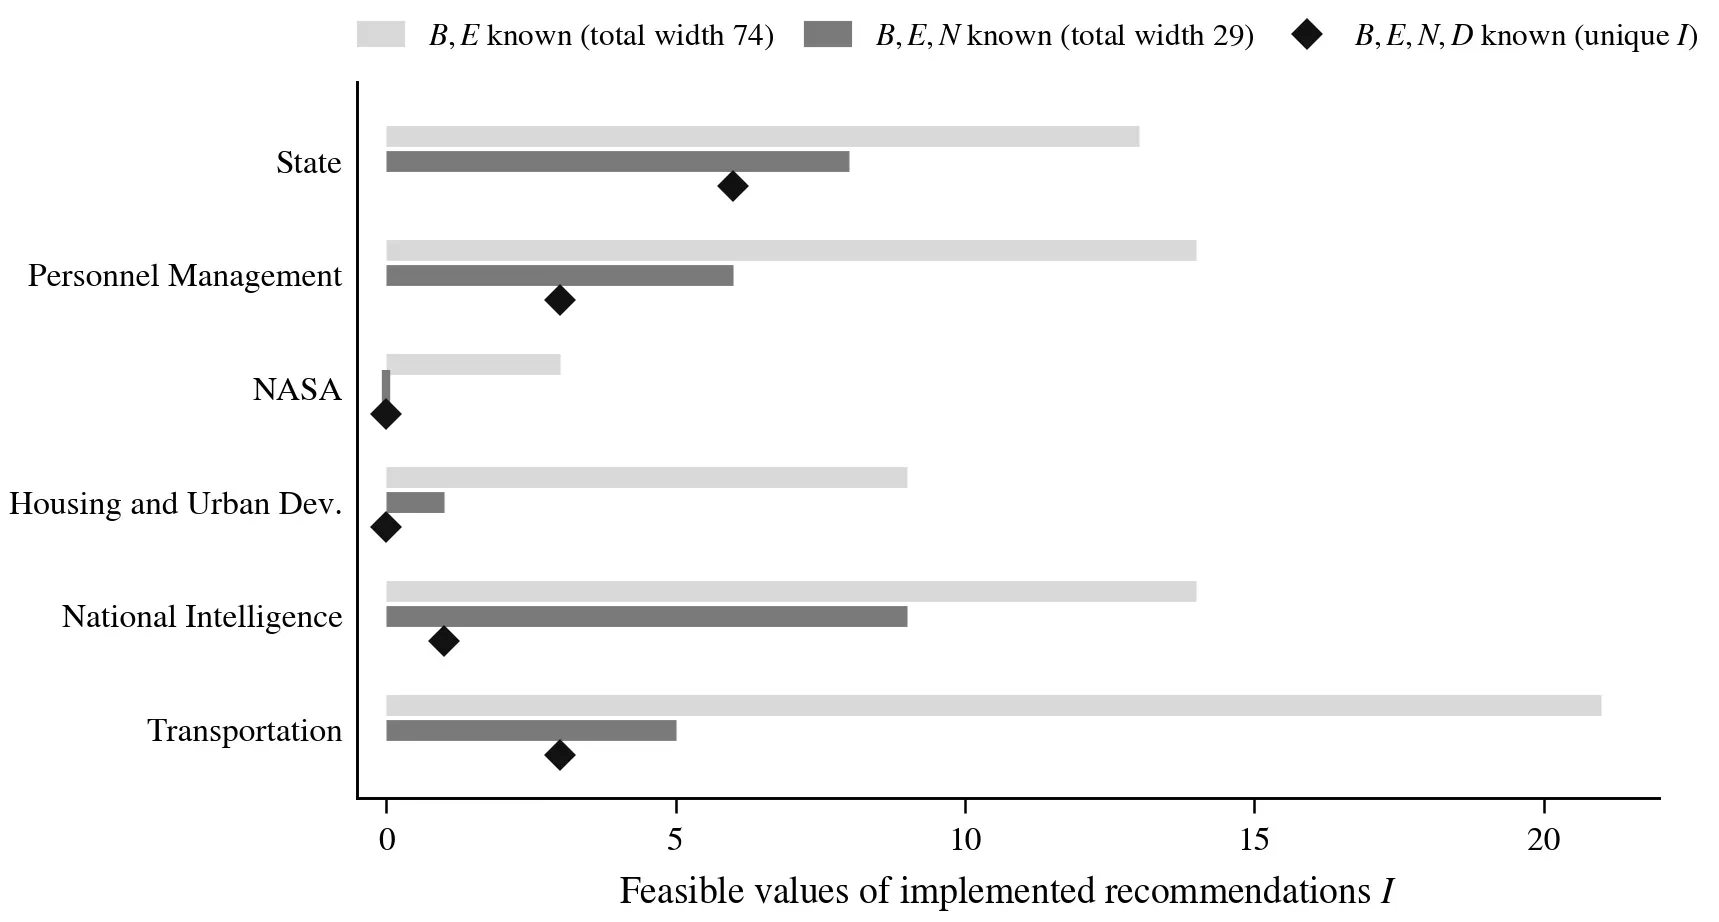
Figure 4. Feasible values of implemented recommendations I for six agencies under three information states. Light bars use opening and closing stocks only; dark bars add the reported additions N; diamonds mark the unique value identified once the nonimplementation exits D are also known. Bar lengths equal feasible-interval widths, which total 74 and 29 respectively. NASA is identified once N is known.
NASA began with three priority-open recommendations, ended with four, and added one. Equation (6) then implies I + D = 0. Because both terms are nonnegative, implementation was already uniquely identified as zero; querying the exit count would add nothing to that question [29]. In the six-case exercise, an additions-first rule that acquired the exit count only for cases still unidentified required eleven field requests, compared with twelve for an unconditional two-field rule. These numbers count requests in a deterministic exercise.
The ten-agency example supplies a further comparison. If GAO already provides the implementation count, even eleven extra field requests may be unnecessary for the stated task. If the inquiry instead concerns why the priority list changed, the additions and removals become indispensable. Information has value when it changes an inference or a feasible action that matters to the task.
The relevant decision can often be evaluated with straightforward analysis. An analyst who already knows enough to choose among the available actions can document the conclusion and stop. When a source is contradictory, a date changes the legal status of the event, or two causal explanations imply materially different actions, targeted verification can be valuable. A well-grounded unresolved conclusion can also be a useful output: it tells a decision-maker precisely which claim cannot yet be established, why it matters, and what evidence would change the assessment. Research resources can then be directed toward the remaining questions with material consequences.
8. Discussion: Scope, Alternatives, and Validation
The empirical material supports several propositions directly. A citation is a document-level trace whose relation to textual credit varies across sampling frames and observation conditions [11]. An official evidence review generates different records for mention, study inclusion, and quantitative synthesis [12]. Administrative implementation counts can diverge from changes in outstanding recommendations because the underlying stock has several entry and exit routes [17–32]. Finally, a formal observation model can express what is identified under explicit assumptions and what remains dependent on missing records or uncertain detector calibration [13]. Each result identifies a specific link between a public record, a measurement target, and the resulting inference.
The cases are informative precisely because their target variables differ. NICE supplies a reference standard for inclusion in a defined evidence-review question, with institutional records of exclusions. Distel and colleagues study formal citations and textual recognition in diabetes guidelines using a specific computational method and additional expert assessment. GAO tracks administrative recommendations using official audit procedures. Each example establishes a different empirical relationship. Moving between them requires a deliberate change in unit, target predicate, and reference standard. The ability to transport an observation rule from one setting to another is itself an empirical question.
Mature professional methods provide strong comparators. Legal interpretation, careful reading of authoritative records, conventional stock-flow accounting, process tracing, contribution analysis, and sensitivity analysis already solve many of these tasks [9,10,13]. A more elaborate workflow is justified when it improves a difficult judgment, identifies a consequential uncertainty, or makes evidence acquisition and decision-making more reliable at an acceptable total cost. For straightforward tasks, a concise, correctly sourced answer can be the highest-quality result.
The framework discussed here links target definition, observation, conditional inference, and research or policy action in one traceable sequence. Its empirical examples are developmental illustrations of identification and decision issues. They do not constitute a randomized or independently blinded comparison of this integrated approach against a strong professional baseline. A decisive evaluation would assign comparable unseen cases to independent teams, permit access to the same primary evidence and tools, and compare serious attribution errors, correct unresolved judgments, valid conclusions retained, information-acquisition decisions, and complete research costs. The question is concrete: in which policy tasks does an explicit measurement-and-decision protocol improve what researchers can responsibly conclude or do next?
9. Conclusion
A credible assessment of policy influence begins by defining the relationship under examination. It follows the evidence from source to observation, reconstructs the relevant policy event, identifies what can be inferred, and connects the result to a useful decision. Citation counts, textual matches, review inclusions, administrative actions, and public outcomes all have legitimate roles when their meanings are preserved. The researcher's responsibility is to use the right evidence for the right claim and to invest in further verification when it can improve an important judgment. Evidence-informed policymaking benefits when analysts report a defensible conclusion, identify consequential uncertainty, and match further investigation to the decision that must be made.
References
[1] Organisation for Economic Co-operation and Development (OECD). (2025). Implementation Toolkit for the OECD Recommendation on Public Policy Evaluation. OECD Public Governance Reviews. OECD Publishing. https://doi.org/10.1787/77faa4fe-en
[2] OECD. (2025). Everybody Cares About Using Education Research Sometimes: Perspectives of Knowledge Intermediaries. OECD Publishing. https://doi.org/10.1787/5ef88972-en
[3] OECD & European Commission. (2025). Strengthening National Evidence-Informed Policymaking Ecosystems: Lessons from Seven European Countries. OECD Publishing. https://doi.org/10.1787/855c5286-en
[4] Weiss, C. H. (1979). The many meanings of research utilization. Public Administration Review, 39(5), 426–431. https://doi.org/10.2307/3109916
[5] Kingdon, J. W. (1995). Agendas, Alternatives, and Public Policies (2nd ed.). HarperCollins College Publishers.
[6] Haas, P. M. (1992). Introduction: Epistemic communities and international policy coordination. International Organization, 46(1), 1–35. https://doi.org/10.1017/S0020818300001442
[7] Sabatier, P. A. (1988). An advocacy coalition framework of policy change and the role of policy-oriented learning therein. Policy Sciences, 21(2–3), 129–168. https://doi.org/10.1007/BF00136406
[8] Lukes, S. (1974). Power: A Radical View. Macmillan.
[9] Collier, D. (2011). Understanding process tracing. PS: Political Science & Politics, 44(4), 823–830. https://doi.org/10.1017/S1049096511001429
[10] Mayne, J. (2012). Contribution analysis: Coming of age? Evaluation, 18(3), 270–280. https://doi.org/10.1177/1356389012451663
[11] Distel, A. P., Grimpe, C., & Poetz, M. (2026). From evidence to impact: The use of scientific research in policy documents. Research Policy, 55(3), Article 105426, Appendix 10. https://doi.org/10.1016/j.respol.2026.105426. Open-access final version: https://research-api.cbs.dk/ws/portalfiles/portal/122045046/From_evidence_to_impact_The_use_of_scientific_research_in_policy_documents.pdf
[12] National Guideline Centre (UK). (2019). Hypertension in adults: Diagnosis and management. Evidence Review A: Evidence review for diagnosis. NICE Guideline NG136. National Institute for Health and Care Excellence. See Table 3, Appendix D (clinical evidence tables), and Appendix I.1 (“Excluded clinical studies,” pp. 99–104), Tables 24–25 (exclusions and reasons). Official review: https://www.nice.org.uk/guidance/ng136/evidence/a-diagnosis-pdf-6896748206; Appendix I HTML: https://www.ncbi.nlm.nih.gov/books/NBK578041/
[13] Horowitz, J. L., & Manski, C. F. (1998). Censoring of outcomes and regressors due to survey nonresponse: Identification and estimation using weights and imputations. Journal of Econometrics, 84(1), 37–58. https://doi.org/10.1016/S0304-4076(97)00077-8
[14] Rogan, W. J., & Gladen, B. (1978). Estimating prevalence from the results of a screening test. American Journal of Epidemiology, 107(1), 71–76. https://doi.org/10.1093/oxfordjournals.aje.a112510
[15] Molinari, F. (2008). Partial identification of probability distributions with misclassified data. Journal of Econometrics, 144(1), 81–117. https://doi.org/10.1016/j.jeconom.2007.12.003
[16] U.S. Government Accountability Office (GAO). (2020). Priority Open Recommendations: National Aeronautics and Space Administration. GAO-20-526PR, April 23, 2020. https://www.gao.gov/products/gao-20-526pr
[17] U.S. Government Accountability Office (GAO). (2026). Priority Open Recommendations: U.S. Department of Agriculture. GAO-26-109000. https://www.gao.gov/products/gao-26-109000
[18] GAO. (2026). Priority Open Recommendations: Department of Commerce. GAO-26-108990. https://www.gao.gov/products/gao-26-108990
[19] GAO. (2026). Priority Open Recommendations: Department of Justice. GAO-26-109080. https://www.gao.gov/products/gao-26-109080
[20] GAO. (2026). Priority Open Recommendations: Department of the Interior. GAO-26-109003. https://www.gao.gov/products/gao-26-109003
[21] GAO. (2026). Priority Open Recommendations: Department of the Treasury. GAO-26-108993. https://www.gao.gov/products/gao-26-108993
[22] GAO. (2026). Priority Open Recommendations: Department of Education. GAO-26-108975. https://www.gao.gov/products/gao-26-108975
[23] GAO. (2026). Priority Open Recommendations: Department of Veterans Affairs. GAO-26-108978. https://www.gao.gov/products/gao-26-108978
[24] GAO. (2026). Priority Open Recommendations: Environmental Protection Agency. GAO-26-109002. https://www.gao.gov/products/gao-26-109002
[25] GAO. (2026). Priority Open Recommendations: Social Security Administration. GAO-26-108977. https://www.gao.gov/products/gao-26-108977
[26] GAO. (2026). Priority Open Recommendations: Small Business Administration. GAO-26-108956. https://www.gao.gov/products/gao-26-108956
[27] GAO. (2026). Priority Open Recommendations: Department of State. GAO-26-109086. https://www.gao.gov/products/gao-26-109086
[28] GAO. (2026). Priority Open Recommendations: Office of Personnel Management. GAO-26-108989. https://www.gao.gov/products/gao-26-108989
[29] GAO. (2026). Priority Open Recommendations: National Aeronautics and Space Administration. GAO-26-109162. https://www.gao.gov/products/gao-26-109162
[30] GAO. (2026). Priority Open Recommendations: Department of Housing and Urban Development. GAO-26-108960. https://www.gao.gov/products/gao-26-108960
[31] GAO. (2026). Priority Open Recommendations: Office of the Director of National Intelligence. GAO-26-108954. https://www.gao.gov/products/gao-26-108954
[32] GAO. (2026). Priority Open Recommendations: Department of Transportation. GAO-26-109050. https://www.gao.gov/products/gao-26-109050
Authors

U.S. energy strategist focused on the intersection of clean power, AI grid forecasting, and market economics. Ethan K. Marlow analyzes infrastructure stress points and the race toward 2050 decarbonization scenarios at the Terawatt Times Institute.

Preston studies the policy and social dimensions of the energy transition, focusing on urban electrification, energy equity, and how emerging technologies shape outcomes for middle‑ and working‑class communities.