Market Realisation: Productive Strength and the Limits of Absorption
Market Realisation explains how productive capacity can keep rising while the ability to absorb output weakens. It develops a three-level diagnostic protocol, applies it to China through Q2 2026, and traces how export dependence can narrow the producer’s own market window

Abstract
An economy can grow more capable and less able to sell what it makes at the same time. Productive capacity becomes economically sustainable only when buyers who hold valid claims on its output absorb it, whether households, public institutions, investors or foreign customers, and those claims must also convert into expenditure. When effective capacity persistently outgrows household claims, public purchasing power, income from new tasks and sustainable investment demand, a market-absorption constraint forms. When that constraint survives the exclusion of compositional, statistical, inventory-cycle and temporary-price explanations, and resident gains, profit quality and fiscal foundations weaken together, the result is capacity-surplus structural decline, in which technology improves and output rises while the social return on production erodes.
The paper sets out a three-level diagnostic protocol for the condition and applies it to Chinese industrial data through the second quarter of 2026. Utilisation fell for three consecutive quarters while industrial value added grew 5.4 percent in the first half, and all five first-level signals are present. That places the observation at the first diagnostic level.
The external side of the same process runs through trading partners. Partners that experience capability erosion restrict access, and the producer's market window narrows. In sectors that meet four specified conditions, the advantaged party's own market realisation depends on its partners retaining the capacity to absorb its output, which gives binding international arrangements a material basis and makes domestic rebalancing a market-realisation strategy as well as a welfare objective.
Keywords: market realisation; overcapacity; capacity utilisation; capacity-surplus structural decline; export dependence; trade defence; household consumption; labour income share; economic rebalancing; China economy; geoeconomic fragmentation; systemic survival compression
1 Introduction
China's plan for expanding consumption during the 15th Five-Year Plan period states that the household consumption rate should rise markedly, and its instruments include higher-quality employment, income growth in step with the economy, more channels of property income, stronger social security and expanded service consumption [1]. The target is notable for its form. It is expressed as a rate of consumption and leaves the level of income implicit, and that choice concedes a point developed below: raising what households are entitled to is one step, and turning that entitlement into purchases is another.
The question behind the target reaches well beyond one economy. Industrial capacity is usually treated as an unambiguous asset, with more plants, better machines and deeper supply chains on the credit side of every national ledger. Capacity has economic value, however, only when someone buys its output on terms that cover its costs. An economy whose capacity grows faster than the claims available to absorb it becomes more capable and less able to realise the value of that capability, and when the shortfall is pushed abroad it meets partners who are rebuilding their own choices.
The mechanism can be stated as three conditional propositions.
- Where effective productive capacity persistently outpaces the sum of household output claims, public purchasing power, income from new tasks and sustainable investment demand, a market-absorption constraint forms.
- Where that constraint persists after four alternative explanations have been excluded (shifts in industry composition, revisions in statistical coverage, an ordinary inventory cycle and temporary price movements), and resident gains, profit quality and fiscal foundations weaken together, it constitutes capacity-surplus structural decline.
- In sectors that meet four specified conditions, the advantaged party's own market realisation depends on its partners' capacity to absorb its output.
The external side of the argument uses the concept of systemic survival compression: the degree to which an asymmetric production or control relationship narrows the practical space in which a dependent party can maintain basic functioning, reproduce its capabilities, obtain realistic alternatives, claim a share of output and correct adverse rules peacefully. Export success can compress trading partners in this sense, and their response is what closes the producer's market window.
Sections 2 to 4 establish how capacity converts into realised demand and when absorption falls short. Sections 5 and 6 show how the shortfall is pushed outward and postponed. Sections 7 and 8 set out a diagnostic protocol and apply it to China. Sections 9 and 10 trace the external feedback and the rebalancing it makes rational, Section 11 places the argument among existing accounts, and Section 12 concludes. A tracking appendix carries the China assessment forward.
2 Capacity Must Be Realised, and Claims Must Convert
Productive capacity becomes economically sustainable only when its output is absorbed through household consumption, public provision, business investment or international exchange. A factory's ability to produce turns into revenue only when a buyer holds a valid claim on its output. Market realisation names that conversion of capacity into revenue, and its failure constrains production as surely as a shortage of inputs does.
Artificial intelligence can enlarge realisation through new products, new industries, lower prices, higher quality, personalised demand, cheaper services and new tasks that generate new incomes. It can also narrow realisation when labour income falls or concentrates, weakening the established routes through which purchasing power reaches households.
A claim on output is necessary for consumption and insufficient for it. Whether claims convert into expenditure depends on three conversion conditions. The first is the stability and predictability of income, since uncertain income is saved. The second is the share of essential costs borne out of pocket, since housing, health care, education and old-age provision absorb claims before discretionary consumption begins. The third is whether the claim is held as a right or granted at discretion, because a discretionary claim cannot anchor a long-term commitment such as a mortgage or a child's education. When these conditions fail, an economy can raise incomes and see savings rise in place of demand. A consumption-rate target speaks to the conversion; an income target speaks only to the claim.
3 The Market-Absorption Constraint
A market-absorption constraint arises when effective productive capacity grows persistently faster than the combination of household output claims, public purchasing capacity, income from new tasks and sustainable investment demand. Two qualifiers carry weight. Effective capacity distinguishes marketable production from technical possibility, since a system may be able to produce more only at costs or quality levels buyers will not accept, and that surplus possibility counts for nothing here. Sustainable investment demand excludes construction financed through continuing debt, which absorbs output temporarily while weakening future financial stability.
Three channels carry the constraint, at two levels. Two concern the level of claims. Composition matters because capital income has a lower propensity to consume, the share of an additional unit of income that is spent, than labour income, so the same national income supports less demand as its composition shifts toward capital. And income can arrive as asset prices and debt in place of purchases of goods and services, so that absorption becomes financial instead of real. The third channel concerns allocation. Each country's optimal strategy is to produce and export, and none wants the role of final absorber, a fallacy of composition operating between states in which a strategy that works for one economy fails when all adopt it at once. This channel leaves world claims on output unchanged and concentrates the shortfall. An individual producing economy then faces effective demand well below what global totals would suggest, and the burden of absorption falls on whichever economies are willing or obliged to run deficits.
Domar identified the underlying dynamic. Investment creates current demand and simultaneously expands future productive capacity, so continued growth requires demand to validate the capacity generated by earlier investment [2]. Harrod developed the same problem in dynamic form [3]. Bhaduri and Marglin showed that a change in the wage share affects demand through consumption, investment and net exports, with the final result depending on the structure of the economy [4], and later research on wage-led growth examines the balance among those channels [5]. The proposition here inherits that conditionality. AI can coexist with adequate demand, and pressure rises when production and productivity expand while broad output claims and sustainable uses of the resulting capacity lag.
A machine-era version of the Domar problem follows as a hypothesis. If AI investment is unusually capital-intensive and its income effects are concentrated, the technology raises the growth rate of capacity while shifting expenditure toward equipment and software and away from wages, widening both sides of the classical problem at once. The condition carries real weight, because AI investment also generates engineering, construction, energy and service income, which pushes demand the other way.
The distributional setting is documented. The International Labour Organization estimates that the global labour income share fell by 1.6 percentage points between 2004 and 2024, reaching 52.3 percent in 2022 and remaining at roughly that level through 2024 [6]. Over those two decades output per hour worked rose 58 percent while labour income rose 53 percent, and the 1.6-point decline represents a shortfall of about 2.4 trillion dollars in labour income in 2024 alone. Nearly 40 percent of the fall occurred during the three pandemic years, and the ILO attributes the trend in part to automation-oriented technological change [6].
The decline is modest in percentage points across twenty years, which rules out any story of collapse. It also arrived in steps concentrated around crises, so the constraint tightens in episodes and a reading taken between crises tends to understate its state.
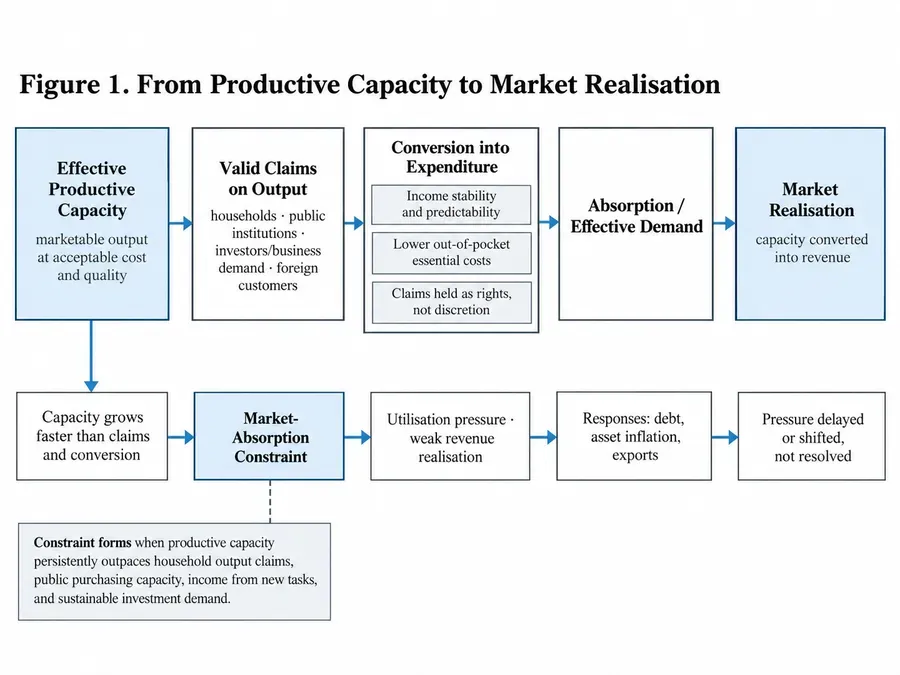
Figure 1. From Productive Capacity to Market Realisation
4 Fixed Cost, Market Window, and Export Dependence
Highly specific intelligent production requires heavy fixed investment in equipment, software, data systems, integration and energy. Once it is installed the marginal cost of additional output may be low, while the enterprise still needs enough utilisation to recover its initial commitment. That threshold is the break-even utilisation rate, the share of installed capacity that must be running for the facility to cover its costs.
When domestic output claims are inadequate, external markets become more important for reaching that threshold. Export dependence can therefore arise from productive strength, fixed costs and weak domestic absorption together, a causal path that runs through capability and distribution and differs from the older story of low relative wages.
The market window is the period during which external markets remain open to a producer's output on terms that sustain its utilisation. It depends on the choices of trading partners, and those choices shift once a dependence becomes politically visible, as partners diversify supply, restrict access and build replacement capacity.
Flexible production reduces dependence on any particular product or market, because its equipment can be reassigned. The need for aggregate demand remains. A versatile production system still requires buyers.
5 Mutual Reinforcement Between Scales
Compression operates at two scales, between states and within them, and the two can reinforce one another. That reinforcement drives the process described here. Weak household claims constrain domestic demand and encourage firms toward export reliance. Trading partners experiencing industrial erosion respond with subsidies, local-content rules, tariffs, technology controls and diversification, so external markets become less secure. Producers then pursue further automation and cost reduction, which puts renewed pressure on domestic labour income and returns the loop to its starting point. The loop is the AI-era form of a mechanism identified in the analysis of global imbalances, where suppressed domestic claims and external surpluses turn out to be two aspects of one distributional arrangement [7].
In the short run the loop reinforces itself, because each step is rational for the party taking it. Producers cut costs because markets are uncertain, and partners restrict access because their capability is eroding. Each step also tightens the constraint the next party faces.
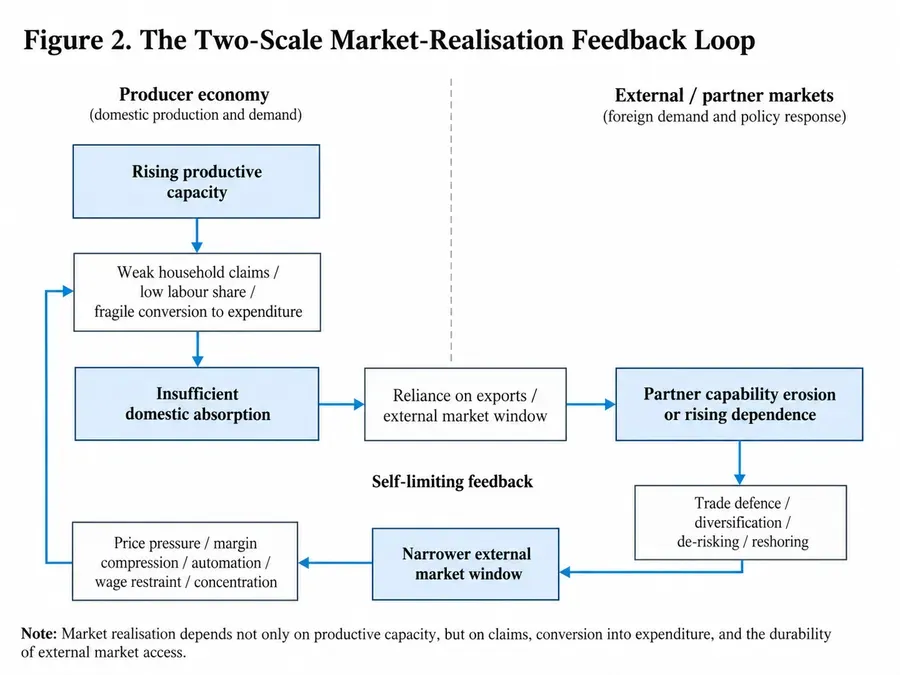
Figure 2. The Two-Scale Market-Realisation Feedback Loop
6 Delay Mechanisms
Two mechanisms postpone the consequences of weak absorption, and both leave the underlying mechanism intact.
Debt allows current expenditure to exceed current income. That is useful when productive investment takes time, when future income is likely to rise, or when a temporary shock must be bridged. Debt becomes a way of transferring pressure when it repeatedly stands in for income growth or durable output claims, since current demand is then maintained through claims on future income, and if that income fails to appear, financial instability joins the original distributional problem. Asset-price inflation works in a similar way. Owners consume more as measured wealth rises, while people without substantial assets benefit less and face higher housing and entry costs, so aggregate expenditure holds while the gap widens between those with and without claims on appreciating assets.
Exports absorb production that domestic households and public institutions do not purchase, supporting utilisation, profits, employment and investment. Persistent export expansion also compresses the industrial space of importing countries, whose producers lose market share, investment, workers and suppliers. The resulting dependence becomes politically visible, and tariffs, subsidies, localisation requirements and diversification follow. Export success thus delays domestic distributional adjustment while raising international pressure, and the exporting economy comes to depend on markets whose participants have growing incentives to reduce that dependence.
A further consequence works through the composition of destinations. The realisation rate is the value realised per unit of physical output. When trade measures displace volume from higher-income to lower-income markets, the same physical output tends to generate less realised value, because absorption capacity depends on income as well as on willingness to buy. Deflection can maintain volume while degrading the realisation rate, which offers one plausible reconciliation of rising surpluses with falling utilisation.
7 Capacity-Surplus Structural Decline: A Diagnostic Protocol
Capacity-surplus structural decline is a condition in which technical and physical productive capacity continue to strengthen while market realisation, enterprise profitability, broad resident gains and fiscal foundations weaken together. It differs from conventional industrial decline. Factories keep operating, technology improves and total production may rise; the structural problem lies in converting productive capacity into durable and widely shared social benefit. The condition is easy to assert and hard to establish, so it is defined here through three ascending thresholds.
The first level consists of diagnostic signals, five indicators observable in quarterly enterprise accounts:
- capacity utilisation below its own long-run level and still falling during a period of output growth;
- leverage rising, with liabilities growing faster than owners' equity;
- receivables expanding while average collection periods lengthen;
- finished-goods inventories growing faster than revenue;
- headline profit improving while concentrating in a few segments.
The second level is a persistent market-realisation constraint. It requires the Level 1 cluster to persist across several periods and four alternative readings to be excluded: shifts in industry composition, revisions in statistical coverage, an ordinary inventory cycle and temporary price movements. The third level, capacity-surplus structural decline proper, adds three conditions to Level 2: a sustained disconnection between broad resident gains and productive capacity, deterioration in the overall quality of enterprise profitability beyond its level alone, and sustained pressure on fiscal foundations through identifiable channels.
Compression of enterprise profit reaches public revenue through corporate taxation, land-related revenue and local financing, so fiscal effects should emerge with a lag specific to each institution. Tax systems, reliance on land revenue, transfer arrangements, local debt maturities and corporate tax settlement periods differ across jurisdictions, and the protocol leaves the duration of the lag as a quantity to be measured. Political consequences lie further downstream and are assessed through recorded decisions, namely documented price premiums, standby capacity, spending on redundancy and accepted losses of output.
Each level draws on a defined set of series. Level 1 uses quarterly capacity utilisation and monthly enterprise financial statistics covering liabilities and owners' equity, receivables and the average collection period, finished-goods inventories, business revenue and profit by industry. Level 2 uses the same series over several periods, together with the tools needed for the four exclusions: industry-level decomposition to test for shifts in composition, the statistical agency's notes on comparable-basis growth rates to test for revisions in coverage, and inventory turnover and producer prices to separate an ordinary inventory cycle and temporary price movements from a persistent constraint. Level 3 adds household disposable income and consumption measured against output, measures of profit quality such as the distribution of margins across industries, and fiscal revenue by channel, including corporate income tax, land-related revenue and local financing.
Table 1. Evidence Requirements for the Three-Level Diagnostic Protocol
| Diagnostic level | Requirement | Evidence to examine | Interpretation |
|---|---|---|---|
| Level 1: Diagnostic signals | A cluster of firm-level signals consistent with an absorption constraint | Capacity utilisation below its long-run level and falling during output growth; liabilities growing faster than owners' equity; receivables rising with longer collection periods; finished-goods inventories growing faster than revenue; headline profit improving while gains concentrate in a few segments | Establishes a first-level diagnostic observation; does not establish structural decline |
| Level 2: Persistent market-realisation constraint | The Level 1 cluster persists across several periods | The Level 1 series tracked over multiple periods | The cluster must remain rather than reverse or normalise |
| Level 2: Alternative explanations | Four competing explanations must be excluded | Industry-level decomposition; statistical-agency coverage notes; inventory turnover; producer prices | Industry composition, statistical coverage, an ordinary inventory cycle and temporary price movements must not explain the cluster |
| Level 3: Resident gains | Broad resident gains weaken relative to productive capacity | Household disposable income and consumption measured against output | Tests whether productive strength is translating into broad resident benefit |
| Level 3: Profit quality | Enterprise profitability deteriorates in quality, not only level | Distribution of margins and profits across industries | Tests whether headline profit masks concentration or weakening underlying profitability |
| Level 3: Fiscal foundations | Fiscal capacity comes under sustained pressure through identifiable channels | Corporate income tax, land-related revenue, local financing and related fiscal series | Tests whether the absorption problem has propagated into the public-finance base |
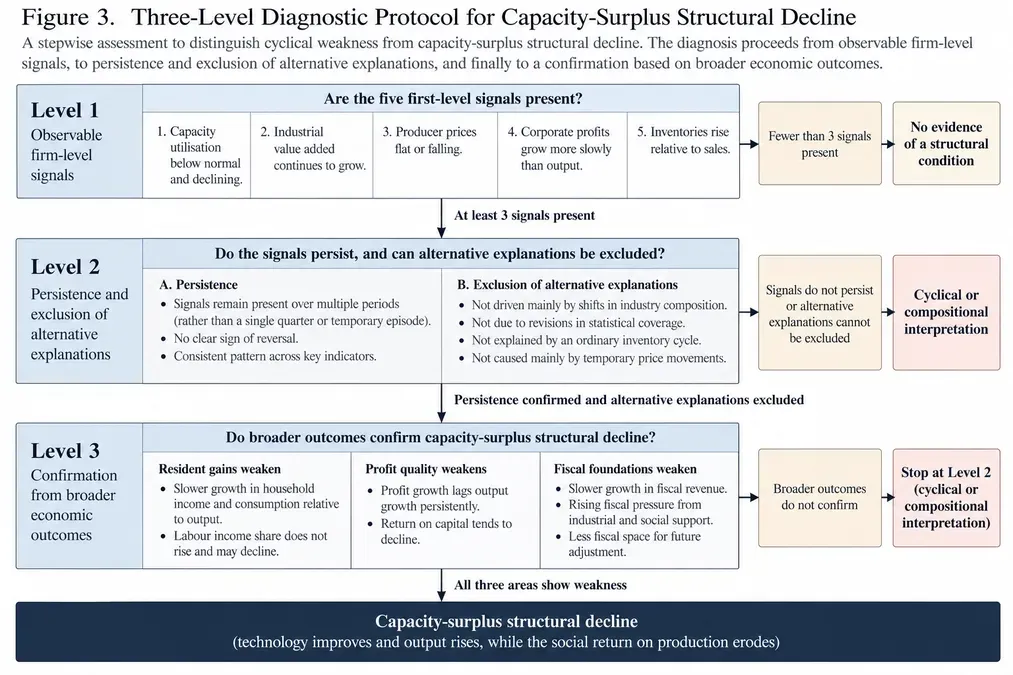
Figure 3. Three-Level Diagnostic Protocol for Capacity-Surplus Structural Decline
8 China as a Live Prospective Test
The assessment in this section uses data through the second quarter of 2026, published by the National Bureau of Statistics on 15 July and 28 July 2026 [8][9]. Later data enter the tracking appendix, and the text of this section stays fixed.
8.1 The Observations
Capacity utilisation for industrial enterprises above designated size fell over three consecutive quarters, from 74.9 percent in the fourth quarter of 2025 to 73.6 percent in the first quarter of 2026 and 73.0 percent in the second. Manufacturing utilisation fell from 75.2 to 73.9 and then 73.5 percent over the same sequence, while industrial value added grew by 5.4 percent over the first half of 2026 [8].
The balance sheet at the end of June tells the same story [9]. The asset-liability ratio stood at 58.3 percent, with liabilities up 6.6 percent against owners' equity up 5.4 percent. Receivables reached 28.60 trillion yuan, up 8.1 percent, with an average collection period of 71.7 days, and finished-goods inventories rose 9.5 percent. First-half profits rose 18.7 percent, with highly uneven gains. Profits in non-ferrous metals and electronics rose 99.4 and 96.9 percent, while those in automobiles, ferrous metals and non-metallic minerals fell 19.5, 25.0 and 47.8 percent.
8.2 The Assessment
Each of the five Level 1 indicators can be checked against the same statistical releases and the bureau's earlier releases.
- Utilisation is below its long-run level and falling during output growth. Second-quarter utilisation of 73.0 percent was 1.0 point below the same quarter of 2025, and first-half utilisation of 73.3 percent was 0.7 points below the first half of 2025 [8]. Comparing like quarters removes seasonal effects. Second-quarter utilisation stood at 74.5 percent in 2023, 74.9 percent in 2024 and 74.0 percent in 2025, and full-year utilisation was 75.1 percent in 2023 and 75.0 percent in 2024 [10]. The 2026 reading sits below all of them while industrial value added grew by 5.4 percent. The indicator is met.
- Liabilities grew 6.6 percent and owners' equity 5.4 percent, and the asset-liability ratio of 58.3 percent was 0.3 points higher than a year earlier [9]. The indicator is met.
- Receivables grew 8.1 percent against business revenue growth of 6.5 percent, and the average collection period of 71.7 days was 0.8 days longer than a year earlier [9]. The indicator is met.
- Finished-goods inventories grew 9.5 percent against revenue growth of 6.5 percent, and inventory turnover lengthened by 0.4 days to 21.1 days [9]. The indicator is met.
- Total profit rose 18.7 percent and the revenue margin rose 0.59 points to 5.70 percent [9]. Two industries, non-ferrous metal smelting and electronics, generated 22.5 percent of first-half profit and, on a back-calculation from the bureau's comparable-basis growth rates, roughly seven-tenths of the year-on-year increase. Profit fell in automobiles, ferrous metals, non-metallic mineral products and electrical machinery [9]. The indicator is met.
The margin gain itself was concentrated. Revenue grew 6.5 percent while operating costs grew 5.9 percent, and costs per hundred yuan of revenue fell by 0.55 yuan [9], an improvement that the industry breakdown above attributes largely to two sectors.
Table 2. China Level 1 Diagnostic Assessment, First Half of 2026
| Level 1 indicator | First-half 2026 evidence | Relevant comparison | Assessment |
|---|---|---|---|
| 1. Falling utilisation during output growth | Industrial utilisation fell to 73.6% in Q1 and 73.0% in Q2; industrial value added grew 5.4% in H1 | Q2 utilisation: 74.5% in 2023, 74.9% in 2024 and 74.0% in 2025 | Met |
| 2. Liabilities growing faster than equity | Liabilities rose 6.6%; owners' equity rose 5.4%; asset-liability ratio reached 58.3% | Asset-liability ratio was 0.3 percentage points higher than a year earlier | Met |
| 3. Receivables expanding and collection slowing | Receivables reached RMB 28.60 trillion, up 8.1%; average collection period reached 71.7 days | Revenue grew 6.5%; collection period lengthened by 0.8 days | Met |
| 4. Finished-goods inventories outpacing revenue | Finished-goods inventories rose 9.5% | Revenue rose 6.5%; inventory turnover lengthened by 0.4 days to 21.1 days | Met |
| 5. Headline profit improving while gains concentrate | Total profit rose 18.7%; margin rose to 5.70% | Non-ferrous metals and electronics generated 22.5% of H1 profit and approximately seven-tenths of the year-on-year increase; several major industries recorded profit declines | Met |
All five Level 1 indicators are present in the first-half 2026 data, and the condition established is Level 1. Level 2 requires the cluster to persist across several periods and the four alternative explanations to be excluded, and Level 3 requires the further evidence set out in Section 7. A single half-year establishes neither. One of the four exclusions required at Level 2 can already be partly addressed from the releases themselves. The bureau calculates profit and revenue growth on a comparable basis, adjusting for the annual change in the set of enterprises above the designated size, for enterprises removed after statistical inspection and for duplicate records eliminated across regions and industries [9]. Revisions in coverage are thus handled in the growth rates used here, and the remaining exclusions (composition, the inventory cycle and temporary prices) require the multi-period series described in Section 7.
The discriminating comparison is with ordinary cyclical weakness. In a cyclical downturn, falling utilisation comes with weakening output, or is followed by inventory normalisation as production adjusts. Cyclical weakness does not by itself produce the persistent combination observed here: rising output, falling utilisation, lengthening collection, inventories growing faster than revenue and profit gains concentrating in a few industries. The observation rests on that combination, and it places the data at Level 1. The disconfirming condition is equally clear. If utilisation recovers, inventories and collection periods normalise, household claims rise with output and fiscal capacity remains stable, the cluster should be read as cyclical or compositional, and the protocol stops at Level 1.
8.3 The External Configuration
The domestic signals sit inside an external configuration that Sections 4 to 6 anticipate. In 2025 fifty-two of the world's seventy largest economies launched new trade defence measures or investigations in response to distortions attributed to Chinese export volumes, yet China's trade surplus rose about 20 percent to a record of roughly 1.2 trillion dollars, even as exports to the United States fell [11]. In steel, 75 new anti-dumping and countervailing investigations were opened in 2025, 27 of them against China. Eighteen countries initiated cases, all but one preliminary determination was positive, the time to a preliminary determination fell from around 200 days to 144, and the stock of such measures in force, counting cases initiated since 2016, reached a record 395 [12]. Brazil alone conducted twenty-nine China-related anti-dumping investigations from the start of 2023, across steel, fibre optics, medical products and petrochemicals [13]. Exports have been redirected as well. In the first nine months of 2025 China's exports to the United States fell 16.9 percent, while exports to ASEAN rose 14.8 percent, to India 12.9 percent, to Africa 28.2 percent and to Latin America 7.0 percent [13]. At home, raising the household consumption rate markedly is a headline objective of the plan for the current five-year period [1].
8.4 Theoretical Inferences
Four inferences follow. Trade measures at this scale coinciding with a record surplus are what the mechanisms predict at this stage, since trade measures redirect flows before substitute capacity exists to absorb them and early substitution runs through resourcing, turning to another supplier being faster than building domestic capacity. Export volume is therefore a lagging indicator of the market window. Redirection toward lower-income destinations plausibly degrades the realisation rate, for the reasons given in Section 6, which offers one reconciliation of a record surplus with falling utilisation. While the window stays open, efficiency continues to be rewarded, so capacity commitments continue and break-even utilisation rises further. And the domestic campaign against "involutionary" competition targets the behaviour that this incentive structure generates: an expert commentary from the State Information Center, published by the planning commission, describes it as pricing seriously below cost in order to seize market share, and proposes maximum collection periods for receivables along supply chains, a remedy aimed directly at the collection indicator of Section 8.2 [14].
8.5 Conditional Prediction
Three conditions could each bring the conversion of advantage into constraint about. Substitute capacity could reach minimum efficient scale, the smallest output at which unit costs reach their lowest level, in enough markets; deflection destinations could reach their income ceiling; or domestic break-even utilisation could bind before external demand recovers. In any of these cases the market window narrows, and the three attributes that now constitute advantage turn into constraint. Scale raises break-even utilisation, efficiency rewards further capacity commitments, and the completeness of the industrial system becomes a form of asset specificity, since each node is optimised for the others and partial conversion is correspondingly harder.
The conversion should be uneven. It should arrive earlier in knowledge-intensive links, where the missing element is codified knowledge and substitution is correspondingly feasible, and later in links that require certification, practised execution, supplier ecology or long-lead equipment. Practised execution here means the ability to perform an operation to a required standard and to inspect and adjudicate defects in it, held by people who do the work. Because the complementary assets for deploying AI in manufacturing are unequally held, closure should more often take the form of political action by parties that cannot yet replace capability than of completed replacement. Such measures widen the importing party's realistic alternatives narrowly and leave it unable to run and maintain a replacement system of its own, so they compress both parties, the importer left without capability and the exporter without realisation space.
Five leading indicators track the prediction: commissioned substitute capacity counted separately from announced capacity; compliance rates with local-content requirements; the composition of substitution by channel (localisation, resourcing from other suppliers, technological substitution and inward investment), particularly the share attributable to localisation and technological substitution; the income level of deflection destinations; and the relation between domestic break-even utilisation and external order books. The prediction would be weakened if substitute capacity, qualified suppliers and autonomous maintenance capability consistently appeared before restrictive measures; if utilisation recovered while export volumes fell, indicating that domestic absorption had replaced external demand; or if surpluses were sustained alongside rising realisation rates in the destinations receiving deflected volume.
8.6 Three Positions at Once
The economy in question occupies three positions simultaneously. It is the advantaged party in its international production relationships. It is a potential compressed party, through premature market closure. And its own capability reproduction depends on sustaining the utilisation and margins that finance investment, training and supplier renewal. No conventional indicator holds those three positions together. The analysis has to, because compression is a property of relationships and one actor stands in more than one.
9 The International Market as a Reverse Constraint
A production centre can depend heavily on external markets while controlling a large share of global supply, and trading partners respond to perceived capability erosion through subsidies, supply diversification, local-production requirements, market restrictions or technological separation. The result is a feedback loop. Efficient concentration first lowers prices and displaces alternative production, capabilities weaken elsewhere, and the dependence becomes politically visible. Trading partners then invest in replacement or restrict access, and the original production centre loses part of its market window. The loop requires no uniform motive. It follows from observable adjustments to capability, dependence and market access.
The loop acts directly on the advantaged party as well. For the compressed party, capability erosion reduces absorption capacity along with production, since industrial exit removes employment and tax base, damaged reproduction lowers long-run income growth, and bearing adjustment costs alone compresses purchasing power. When the advantaged party's own realisation depends on that absorption capacity, compression acquires a self-limiting property: pressing it further erodes the market the pressure was meant to win.
Four conditions determine how strong that property is. Three concern the advantaged party's exposure: the compressed party must be a significant end market for its output, that market must be difficult to replace with third markets, and its production must involve high fixed costs and a correspondingly high break-even utilisation rate, which makes lost volume expensive as well as unwelcome. The fourth concerns transmission at the other end, since the compressed party's capability decline must actually reach its purchasing power, with debt, transfers or asset income leaving it uncompensated.
The counter-prediction is equally precise. If the advantaged party can readily replace the market, expand domestic absorption or sustain low utilisation, the self-limiting mechanism should be weak or absent. It is thus a condition distributed across sectors, and its observable consequence is that willingness to accept binding arrangements runs higher in sectors meeting the four conditions than in sectors that do not.
Table 3. Conditions for the Self-Limiting International Market Constraint
| Condition | Mechanism | Observable implication | Condition weakening the mechanism |
|---|---|---|---|
| 1. The compressed party is a significant end market | Capability erosion in the importing economy can reduce demand for the advantaged party's output | A material share of sectoral output depends on sales to the affected market | The market represents only a small share of realised demand |
| 2. The market is difficult to replace | Lost absorption cannot readily be redirected elsewhere | Third markets cannot absorb comparable volume on comparable terms | Output can be redirected rapidly to alternative markets |
| 3. Production carries high fixed costs and high break-even utilisation | Lost volume raises unit-cost and utilisation pressure on the advantaged producer | Market closure produces meaningful utilisation and margin pressure | Producers can operate sustainably at substantially lower utilisation |
| 4. Capability decline reaches purchasing power | Industrial erosion reduces employment, tax base and long-run income, shrinking the partner's absorption capacity | Capability decline is accompanied by weaker purchasing power and demand | Debt, transfers or asset income substantially compensate for the lost purchasing power |
| Counter-prediction | The self-limiting property should weaken when the advantaged party can substitute other sources of absorption | Binding arrangements should be less likely where domestic demand, third markets or low-utilisation operation substitute for the compressed party's demand | Ready market substitution, stronger domestic absorption or sustainable low utilisation |
10 Rebalancing
An economy with concentrated capital income and weak household output claims needs to direct more of its productive gains toward residents and public institutions, through wages, ownership, services, cash and time. China's instrument list [1] reads usefully against the conversion conditions of Section 2. Wage growth and property income address the claim. Social security and expanded service consumption address the conversion, since they lower the out-of-pocket share of essential costs and stabilise expected income. A plan that targeted only the first group would raise incomes without raising consumption, which is why the target itself is a rate.
Domestic rebalancing is also a market-realisation strategy. Expanding domestic output claims is one of the few mechanisms that can reduce pressure at both ends of a relationship at once, because it lowers dependence on external absorption without requiring another party's capability to be destroyed. Open interfaces, joint investment, supply assurance and maintenance rights can produce two-sided improvement as well. In the configuration of Section 8, rebalancing preserves the external absorption on which concentrated production still depends.
For states whose industrial capability has eroded, international rebalancing means rebuilding the necessary physical, intelligent and control capabilities, judged by critical function and control, without reproducing every former industry at unlimited cost. The feasibility of international arrangements is usually thought to rest on the self-restraint of the advantaged party or on external pressure. Section 9 supplies a different basis. Rising compression lowers both the productive capability and the absorption capacity of the compressed party, and when the second is a condition for the advantaged party's own realisation, that party faces an intertemporal trade-off. In the short run, compressing a counterparty's capability expands market share and control. Over the medium term the same process shrinks the space in which its own output can be realised.
International constraint can therefore rest on material interest, independent of goodwill or symmetrical retaliatory capability. Its basis is the degree to which the advantaged party depends on the compressed party's absorption capacity, under the four conditions of Section 9 and subject to the counter-prediction stated there. Willingness to accept binding arrangements should accordingly be uneven and observable, higher in sectors where the conditions hold. Constraint should appear sector by sector, tracking sectoral dependence structure, well before it covers a whole political relationship. And the incentive weakens wherever the advantaged party can substitute domestic absorption, third markets or financial channels for the compressed party's absorption capacity.
When the incentive exists, workable arrangements include multiple suppliers, supply-assurance agreements, open interfaces, shared standards, joint capability development, transparent licensing, local maintenance rights and credible dispute settlement. Their common function is to lower the probability that efficient concentration converts into compression. Judged by choice restoration, operational autonomy, the avoidance of equivalent reconcentration and limited transfer, capability reconstruction that restores critical control while retaining non-critical links outperforms comprehensive decoupling, and closure attempted before substitute capability exists fails the autonomy test by construction and compresses both parties.
11 Relation to Existing Accounts
The market-absorption constraint touches several established literatures, and each explains part of what this paper describes. Keynes established that output and employment are set by effective demand, so an economy can settle below its productive potential [15]. Hobson argued that underconsumption at home drives the search for markets and investment outlets abroad [16]. Hansen, and later Summers, described secular stagnation, a persistent shortfall of demand relative to saving at full employment [17][18]. Glyn and Sutcliffe traced how distributional conflict and international competition can squeeze profits [19], and the wage-led growth literature shows that the effect of distribution on demand depends on the structure of the economy [4][5]. Richard Koo showed how firms repairing their balance sheets can depress demand for years after an asset-price collapse [20]. Analysts of global imbalances have linked surplus saving in some economies to deficits in others, from the saving-glut account [21] to the view that imbalances express domestic distribution [7]. Overcapacity, in its conventional sense, describes production capacity exceeding market-based demand, often sustained by policy support [13].
Three features set the present account apart. The first is the state it describes: technical and physical capability continue to strengthen while realisation weakens. Effective-demand, stagnation and balance-sheet accounts explain why output falls short of potential. Here output keeps rising, and the shortfall appears in utilisation, collection, inventories and the distribution of profit. The second is diagnosability. The three-level protocol of Section 7 requires the signals to persist, and four alternative explanations (composition, coverage, the inventory cycle and temporary prices) to be excluded, before a structural reading is allowed, and it states what would stop the protocol at Level 1. The third is the loop through partners. Imbalance accounts trace the financial counterpart of surpluses. The reverse constraint of Section 9 traces how surpluses compress partners' capability, how partners respond, and how that response narrows the producer's own market window, under four stated conditions and with a counter-prediction.
12 Conclusion
Productive strength and market realisation are separate quantities. An economy whose effective capacity outgrows the claims available to absorb it becomes more capable and less able to convert capability into durable social benefit.
Debt, asset appreciation and exports can postpone the shortfall. Postponement changes where the pressure lands and leaves its source in place. When exports carry the shortfall abroad, they meet partners whose capability is eroding and whose response narrows the market window, and the advantaged party discovers that its own realisation depends on the absorption capacity of the parties its success has compressed.
The diagnostic protocol makes that process observable in stages. Chinese data through the second quarter of 2026 show all five Level 1 signals, and the tracking appendix will record whether the cluster persists into Level 2 or falls back.
The policy implication follows from the mechanism. Expanding domestic output claims reduces pressure at both ends of a relationship at once, and its effect depends on whether those claims convert into expenditure. An economy that raises household claims, lowers the out-of-pocket share of essential costs and gives claims the status of rights strengthens its own market realisation and preserves the external absorption on which concentrated production still depends.
Tracking Appendix
Each entry in the tracking appendix records seven fields.
| Field | Content |
|---|---|
| Data release date | Publication date of the statistical release used |
| Current-period data | Values of the Level 1 indicators, and of Level 2 and Level 3 inputs where available |
| Previous assessment | The protocol level and judgement recorded in the preceding entry |
| New evidence | What changed since the preceding entry |
| Judgement maintained or revised | The protocol level after this entry |
| Reason | The evidence that decided the judgement |
| Disconfirming conditions tested | Which of the disconfirming conditions in Section 8.2 were tested in this entry, and with what result |
Baseline entry (text data cutoff).
| Field | Content |
|---|---|
| Data release date | 15 July 2026 and 28 July 2026 [8][9]; comparison releases [10] |
| Current-period data | As reported in Sections 8.1 and 8.2 |
| Previous assessment | None; this is the baseline |
| New evidence | Not applicable |
| Judgement | Level 1: all five indicators met |
| Reason | Utilisation below the same quarter of 2023, 2024 and 2025 during output growth; liabilities outpacing equity; collection period up 0.8 days; inventories outpacing revenue; profit gains concentrated in two industries |
| Disconfirming conditions tested | Utilisation recovery, normalisation of inventories and collection periods, household claims rising with output, fiscal stability: none satisfied at cutoff |
The first update entry will use the third-quarter 2026 releases.
Monitoring items for the realisation rate. Each entry adds, by destination income group, export unit values, export price indices where available, product mix within tariff chapters, and export margins and payment terms where firm data allow. The inference in Section 6 is supported if unit values fall with the shift toward lower-income destinations after product mix is held constant, and weakened if they hold or rise.
Calculation note. The share of the profit increase attributed to non-ferrous metal smelting and electronics in Section 8.2 is computed by dividing each industry's first-half 2026 profit by one plus its reported growth rate to obtain the implied prior-year level, summing the two implied increases, and dividing by the implied increase in total profit. The bureau reports growth on a comparable basis, so the result is an approximation.
References
[1] State Council of the People's Republic of China. Reply of the State Council on the Plan for Expanding Consumption during the 15th Five-Year Plan Period [in Chinese]. State Council Document Guohan (2026) No. 66, issued 13 July 2026; annexed plan prepared by the National Development and Reform Commission and Ministry of Commerce. https://www.gov.cn/zhengce/zhengceku/202607/content_7075217.htm.
[2] Domar, Evsey D. "Capital Expansion, Rate of Growth, and Employment." Econometrica 14, no. 2 (1946): 137–147. https://doi.org/10.2307/1905364.
[3] Harrod, Roy F. "An Essay in Dynamic Theory." Economic Journal 49, no. 193 (1939): 14–33.
[4] Bhaduri, Amit, and Stephen Marglin. "Unemployment and the Real Wage: The Economic Basis for Contesting Political Ideologies." Cambridge Journal of Economics 14, no. 4 (1990): 375–393.
[5] Lavoie, Marc, and Engelbert Stockhammer, eds. Wage-Led Growth: An Equitable Strategy for Economic Recovery. Geneva: International Labour Organization, 2013.
[6] International Labour Organization. World Employment and Social Outlook: September 2024 Update. Geneva: ILO, 2024.
[7] Klein, Matthew C., and Michael Pettis. Trade Wars Are Class Wars: How Rising Inequality Distorts the Global Economy and Threatens International Peace. New Haven, CT: Yale University Press, 2020.
[8] National Bureau of Statistics of China. "Industrial Capacity Utilisation Rate in the Fourth Quarter of 2025," 19 January 2026; "Industrial Capacity Utilisation Rate in the First Quarter of 2026," 16 April 2026; "Industrial Capacity Utilisation Rate in the Second Quarter of 2026," 15 July 2026; and "Industrial Value Added in June 2026," 15 July 2026. Beijing. https://www.stats.gov.cn/sj/zxfbhjd/202601/t20260119_1962320.html; https://www.stats.gov.cn/sj/zxfb/202604/t20260416_1963322.html; https://www.stats.gov.cn/sj/zxfbhjd/202607/t20260715_1964130.html; https://www.stats.gov.cn/sj/zxfb/202607/t20260715_1964123.html.
[9] National Bureau of Statistics of China. "Profits of Industrial Enterprises above the Designated Size from January to June in 2026." 28 July 2026. https://www.stats.gov.cn/english/PressRelease/202607/t20260728_1964201.html.
[10] National Bureau of Statistics of China. "Industrial Capacity Utilisation Rate in the Fourth Quarter of 2023" [in Chinese], 17 January 2024; "Industrial Capacity Utilisation Rate in the Second Quarter of 2024" [in Chinese], 15 July 2024; "Industrial Capacity Utilisation Rate in the Fourth Quarter of 2024" [in Chinese], 17 January 2025; and "Industrial Capacity Utilisation Rate in the Second Quarter of 2025" [in Chinese], 15 July 2025. Beijing. https://www.stats.gov.cn/xxgk/sjfb/zxfb2020/202401/t20240117_1946625.html; https://www.stats.gov.cn/sj/zxfb/202407/t20240715_1955616.html; https://www.stats.gov.cn/xxgk/sjfb/zxfb2020/202501/t20250117_1958324.html; https://www.stats.gov.cn/sj/zxfb/202507/t20250715_1960404.html.
[11] Gunter, Jacob, and Claus Soong. "Many Countries Launch New Trade Measures – But China's Exports Just Keep Growing." MERICS Comment, 19 February 2026. https://merics.org/en/comment/many-countries-launch-new-trade-measures-chinas-exports-just-keep-growing.
[12] Organisation for Economic Co-operation and Development. OECD Steel Outlook 2026. Paris: OECD Publishing, 4 June 2026, chap. 5, "Trade Actions Increase as the Steel Crisis Worsens," pp. 63–71. https://doi.org/10.1787/99ab9b0c-en.
[13] Kelly, Brendan. "Higher Tariffs in U.S., Mexico Part of Global Response to China Export Surge." In Breaking China: Reordering Global Trade and the Evolving U.S.–Mexico Relationship, part III. Dallas: Federal Reserve Bank of Dallas, 31 October 2025. https://www.dallasfed.org/research/pubs/25trade/a3.
[14] Wei, Qijia. "Comprehensively Addressing 'Involutionary' Competition" [in Chinese]. Expert commentary, State Information Center, originally in Jiefang Daily; published by the National Development and Reform Commission, 14 July 2025. https://www.ndrc.gov.cn/wsdwhfz/202507/t20250714_1399160.html.
[15] Keynes, John Maynard. The General Theory of Employment, Interest and Money. London: Macmillan, 1936.
[16] Hobson, John A. Imperialism: A Study. London: James Nisbet, 1902.
[17] Hansen, Alvin H. "Economic Progress and Declining Population Growth." American Economic Review 29, no. 1 (1939): 1–15.
[18] Summers, Lawrence H. "U.S. Economic Prospects: Secular Stagnation, Hysteresis, and the Zero Lower Bound." Business Economics 49, no. 2 (2014): 65–73.
[19] Glyn, Andrew, and Bob Sutcliffe. British Capitalism, Workers and the Profits Squeeze. Harmondsworth: Penguin, 1972.
[20] Koo, Richard C. The Holy Grail of Macroeconomics: Lessons from Japan's Great Recession. Singapore: John Wiley & Sons, 2008.
[21] Bernanke, Ben S. "The Global Saving Glut and the U.S. Current Account Deficit." Sandridge Lecture, Virginia Association of Economists, Richmond, 10 March 2005.
Authors

Alex is the founder of the Terawatt Times Institute, developing cognitive-structural frameworks for AI, energy transitions, and societal change. His work examines how emerging technologies reshape political behavior and civilizational stability.

U.S. energy strategist focused on the intersection of clean power, AI grid forecasting, and market economics. Ethan K. Marlow analyzes infrastructure stress points and the race toward 2050 decarbonization scenarios at the Terawatt Times Institute.

Caroline is a Houston-born analyst focusing on Gulf Coast oil, LNG, and industrial electrification. She studies how legacy energy systems and new clean-power infrastructure reshape the economic future of the American South.