Capability Reproduction: Industrial Recovery and the Conditional Returns to AI
Capability Reproduction explains why industries can retain market position while losing the ability to recover. Using shipbuilding and nuclear construction, it shows how skills, suppliers, throughput, and complementary assets determine whether AI can shorten the road back.

Abstract
Industrial policy across advanced economies has returned to an old question with new urgency: can an economy that has stopped making something start making it again, and how long will that take? This paper argues that current productive capacity and recovery capability are different quantities. Output, orders and market share describe what an industry does today. Recovery capability, the ability to re-enter, re-expand or rebuild after conditions change, rests on the carriers of capability: suppliers, equipment renewal, apprenticeship, engineering succession, testing, certification and a continuous flow of work.
Two cases show that capability reproduction can fail while competitive position holds, through distinct mechanisms. Korean shipbuilding took 21 percent of global new orders in 2025 while its flow of young entrants thinned. French nuclear construction kept its reactor fleet and a validated design while two decades without new building eroded the practised execution of nuclear-grade welding, and Flamanville 3 took nearly seventeen years from the start of construction to its first chain reaction. Japan's shipbuilding roadmap plans nine years and about one trillion yen to double annual output. Together these anchors show recovery unfolding over fiscal cycles, and a recursive rebuilding bottleneck lengthens the timeline further, since the equipment and skills that rebuilding needs are themselves scarce.
Artificial intelligence enters as a conditional variable. It lowers recovery costs where the missing capability is codified knowledge and the complementary assets for deployment are present. When the gap lies in physical capacity, control rights or practised execution, or the complements are absent, its early effect is to widen recovery gaps.
Keywords: capability reproduction; industrial recovery; reshoring; manufacturing capability; artificial intelligence; complementary assets; practised execution; shipbuilding; nuclear construction; supply chain resilience; industrial policy; systemic survival compression
1 Introduction
1.1 Current Pressure and Capability Erosion
An industry can face severe pressure without losing its long-term ability to recover. Falling prices, shrinking margins, import penetration, declining utilisation, reduced employment and lost market share all describe present commercial conditions. They say little about whether the underlying capability still exists.
Erosion shows itself through deeper and more persistent changes. Net investment stays below the level needed to renew equipment. Suppliers exit and nobody replaces them. Apprenticeships decline, experienced engineers and production workers leave the field, and new firms stop entering. Testing, certification, software and systems-integration capabilities weaken, until the industry can no longer return to the technological frontier. That last loss is the one that matters for the future. Capability reproduction names the process erosion interrupts: the continuous maintenance, over time, of the productive, occupational, technical and institutional abilities an industry needs to keep producing and to produce again.
1.2 Recovery as the Decisive Test
The strongest evidence of erosion appears when external conditions improve. Suppose demand, prices, financing or policy support turn favourable. Can firms re-enter, can equipment be installed, can suppliers deliver the required inputs? Can skilled workers be recruited or trained, and can products meet current technical and regulatory standards? How much time and public support will the answers cost?
Two parties can absorb the same market loss and face entirely different situations afterwards. One returns when the price recovers. The other finds that the plant, the people and the paperwork it would need have gone. Recovery capability, the ability to re-enter, re-expand or rebuild after conditions change, separates the two. Only the second case amounts to what this paper calls systemic survival compression: the persistent narrowing of a dependent party's practical space to maintain its functioning, reproduce its capabilities and obtain realistic alternatives. Recovery capability deserves measurement in its own right.
1.3 The Order of Causation
The mechanism examined here predates generative AI. Capability erosion in industrial economies was under way long before the current wave of models, and the cases in Sections 6 and 7 establish its shape without reference to them. They also establish its tempo. Recovery unfolds over fiscal cycles, measured in budgets and parliaments, while procurement moves in quarters.
Artificial intelligence changes one parameter in this calculation, namely whether recovery is feasible at a given cost and speed, and it changes that parameter unevenly. Productive deployment of AI depends on complementary assets that economies hold in very different amounts, so the same technology can shorten one country's road back and leave another's unchanged. This paper therefore treats AI as a conditional variable acting on the recovery link and sets out the historical baseline first.
The argument proceeds in five steps. Section 1.4 places the concept among existing accounts. Sections 2 to 5 establish where capability is stored and how reproduction can fail while position holds, Sections 6 and 7 present shipbuilding and French nuclear construction, Section 8 explains why money arrives years before capacity, and Sections 9 and 10 treat artificial intelligence and the routes to recovery. Section 11 concludes.
1.4 Relation to Existing Accounts
Several literatures study how productive capability forms, and capability reproduction draws on each. Learning-by-doing models show productivity rising with cumulative output [1]. Evolutionary economics locates capability in organisational routines that persist through use [2]. Absorptive-capacity research explains how prior knowledge governs a firm's ability to take in external knowledge [3], and the dynamic-capabilities view studies how firms reconfigure resources as environments change [4]. Path-dependence accounts show how early choices lock in later outcomes [5]. Work on the industrial commons argues that manufacturing know-how is shared across the firms of a place and can leave with production [6], and innovation-system research places capability in networks of firms, institutions and skills at national and sectoral level [7][8]. Polanyi explained why some capability cannot be written down [9], and research on situated learning shows how it passes to novices through supervised participation in real work [10].
Capability reproduction builds on these accounts and asks a different question. They explain how capability is formed, absorbed, deployed or reconfigured. This paper asks whether the carriers of capability (suppliers, practitioners, routines and certified processes) go on regenerating over time, and what recovery requires once regeneration stops. Three consequences follow. Recovery capability becomes a quantity separate from current output, measurable before it is needed. Reproduction can fail while market position holds, through missing entrants or interrupted throughput, a pattern invisible to indicators of firm performance. And the cost of recovery depends on the type of gap and on complementary assets outside the firm, which ties firm-level capability to grids, integrators and trades.
2 Where Industrial Capability Is Stored
Industrial capability is stored in three places. Part of it is explicit, recorded in drawings, software, manuals, process specifications, patents and standards; this part is also called codified knowledge. Part is tacit, held in the judgement of workers, the routines of firms, the accumulated knowledge of suppliers, and an organisation's ability to respond when a process behaves differently from its formal description. And part is embodied in physical assets and institutions, among them machinery, laboratories, electricity systems, logistics, certification bodies and production sites.
AI makes portions of the explicit and organisational layers easier to acquire. Preliminary design, engineering calculation, software development, process documentation, translation, fault diagnosis, scheduling and technical instruction all become cheaper and faster. A smaller firm can obtain analytical support that once required a large engineering department, and a design principle learned over years can sometimes be encoded, simulated and passed on.
The gains are selective. The factory, the electricity grid, the certified supply chain, the stock of specialised materials and the mature network of subcontractors all lie outside what AI can supply. Tacit knowledge that becomes visible only through physical practice and failure resists capture, and a generated process plan still has to work with real tolerances, materials, machines, safety rules and customers.
One category of capability recurs throughout this paper. Practised execution is the capability to perform an operation to a required standard, together with the ability to inspect, commission and adjudicate defects in it. It is held by the people who do the work, transmitted by doing the work alongside them, and it survives only as long as the work continues. Baking offers a simple picture. A recipe can be printed and sold in any bookshop, while the feel for when a dough is ready passes from baker to apprentice at the bench. A bakery that closes for twenty years reopens with the recipe and without the feel.
The practical question in any recovery is therefore which part of the capability system was lost. A region that retains machinery, experienced operators, suppliers and testing institutions can use AI to recover missing design or programming capacity quickly. A region that has lost the entire production ecology faces a harder task, because it must rebuild the physical and organisational carriers of capability as well as the codified knowledge, and codified knowledge is the only one of the three that AI supplies directly.
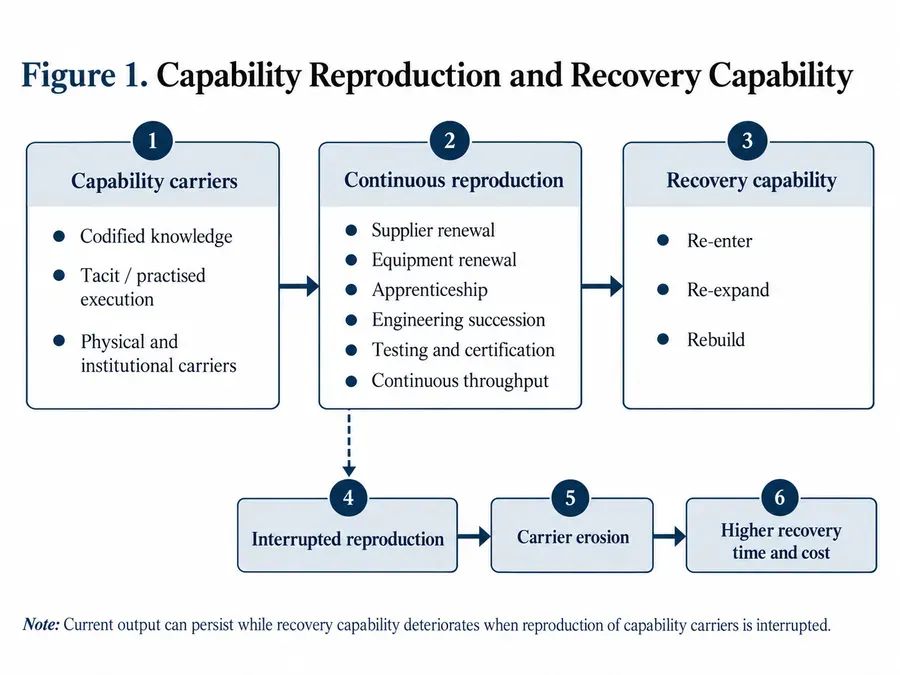
Figure 1. Capability Reproduction and Recovery Capability
3 Asset Specificity and Flexible Production
Traditional automation performs best where products, processes and volumes are stable. A dedicated line delivers high output at low unit cost, and its investment is tied to a narrow use. If the product loses demand, the machinery has little value elsewhere.
Asset specificity describes how far an investment is committed to a particular product, customer, location, technical standard or production process. A stamping die cut for one model of car door is a highly specific asset, superb at its task and close to scrap for any other. Assets of this kind have limited alternative uses and low recovery value outside their original application, involve large sunk costs, and must run at high utilisation to pay for themselves. The break-even utilisation rate is that threshold: the share of installed capacity that must actually be running for the facility to cover its costs. A plant with a high break-even rate loses money quickly whenever orders fall.
AI, machine vision, collaborative robots, modular tooling and easier programming change this relationship. Research at the National Institute of Standards and Technology on low-volume, high-mix production identifies force sensing and compliance, improved calibration, artificial intelligence techniques, simplified programming interfaces and easier reconfiguration as the factors extending robotic assembly beyond mass production [11]. NIST guidance for smaller manufacturers treats work-cell design, task variation, safety and integration requirements as central to successful collaborative-robot adoption [12].
Flexible intelligent production refers to a system in which equipment, software, tooling and human skills can be reassigned to different tasks without reconstructing the whole. A flexible cell is reprogrammed and retooled when the product changes, while a dedicated line needs major new investment. North American order data are consistent with a falling capital threshold for some flexible applications. In 2025 collaborative robots accounted for 19.6 percent of robot units ordered in the region and 10.7 percent of order revenue, although differences in payload, speed, reach and task complexity prevent a direct price comparison with conventional industrial robots [13].
Two automation paths therefore open. Dedicated automation raises productivity inside a stable market while deepening dependence on that market. Flexible intelligent production lowers the cost of conversion and preserves future options. Automation as such has no single effect on market dependence; asset specificity, software access, reprogrammability, worker skills and conversion time determine the outcome.
At the scale of an industry, adaptable equipment and transferable knowledge let a production system convert through a demand shock, while tightly specialised assets and suppliers are efficient in stable conditions and take larger losses when the market moves.
4 Reproduction Can Fail While Position Holds
Erosion is usually read as the consequence of competitive failure: an industry loses customers, then investment, then people. It also occurs where competitive or structural position is intact, and its sources in that setting can be identified. Demographic structure can break intergenerational transmission, as older cohorts retire faster than younger ones arrive. Relative wages can leave an industry unable to attract entrants against competing occupations. The organisational forms through which skill passes from one worker to another, such as apprenticeship under an experienced foreman, can collapse. Output can come to rest on external labour supply in place of local reproduction of skills. A long interruption in throughput can remove the practice through which capability is maintained. And the place where income is formed can drift away from the place where it is absorbed, so that production continuity no longer supports the surrounding economy that reproduces the workforce.
Whether capability reproduction does independent analytical work depends on this distinction. If reproduction failed only where competition failed, it would collapse into a restatement of competitive outcome, and market share would be enough. Sections 6 and 7 show reproduction moving independently of position, through two different mechanisms.
Table 1. Capability Carriers and Indicators of Erosion
| Capability carrier | Reproduction indicator | Evidence of erosion |
|---|---|---|
| Equipment | investment vs depreciation | ageing / non-renewal |
| Suppliers | entry, exit, qualification | supplier disappearance |
| Workforce | age structure, entrants | retirement > entry |
| Apprenticeship | supervised work | apprenticeship collapse |
| Engineering | succession, project continuity | expertise dispersion |
| Testing/certification | facilities, qualified personnel | external dependence |
| Throughput | continuity of projects/work | long project gaps |
5 Enterprise Choice, Capacity Policy, and Option Value
States write industrial policy, and firms decide whether capability survives. Under sustained pressure a firm has four options, each with a different consequence for capability. Continuing to operate preserves workers, supplier relationships, routines, certifications and equipment, at the price of accumulated losses or public support. Reducing output and holding assets dormant keeps the option to return open, while depreciation, interest, maintenance and the slow departure of staff erode it. Conversion depends on whether equipment, software and people can be redirected. Liquidation ends the financial drain and can permanently destroy the organisational carrier of future capability.
An idle facility may retain recoverable equipment, permits, knowledge and relationships; a cleared site requires a new development process from land, permits and grid connection onward.
The literature on irreversible investment supplies the structure of this decision. Where investment is sunk and the future uncertain, waiting has value; the higher the irreversibility, the stronger the incentive to postpone commitment; and financial constraints alter the calculation substantially [14]. Dormant capacity is an option with a carrying cost, and liquidation trades future recovery for present financial certainty. Asset specificity determines which of the four options remain open in the first place.
The same reasoning applies to public capacity policy. Closing firms restores a short-term balance between supply and demand and also destroys employment, tax bases, supplier networks, skills and future recovery options. Some capabilities deserve to go, being obsolete or cheaper to obtain through trade; the relevant line separates the closure of an unproductive asset from the destruction of a capability whose reconstruction would be costly or slow.
Support for a highly specific facility may therefore preserve a strategic option or merely delay the exit of an obsolete asset, depending on the capability it carries, the probability of future need and the cost of alternative recovery routes. Capacity policy should price that option value explicitly.
Sectors built project by project add a further consideration, which the French case in Section 7 makes concrete. There the option value at stake extends beyond any single facility to the continuity of throughput itself. A steady sequence of work sustains practice, supplier qualification and quality assurance. That practice is a capital asset in its own right, and unlike a building it cannot be mothballed.
6 Shipbuilding: Four Positions on One Spectrum
Shipbuilding suits the question of capability reproduction well. It combines large physical assets, long supplier chains, skilled labour, engineering integration, certification and volatile demand, and its products range from simple bulk carriers to highly complex gas carriers and naval vessels.
Because ship types differ greatly in labour and engineering content, the analysis uses compensated gross tonnage (CGT), the OECD shipbuilding measure designed to approximate construction workload. Gross tonnage measures a ship's enclosed volume. CGT weights that volume by a coefficient reflecting how much work each ship type requires, so a complex vessel counts for more than a simple one of the same size [15]. Measured in deadweight tonnes, China's 2025 completions, new orders and order book stood at 56.1, 69.0 and 66.8 percent of world totals [16]; measured in CGT, its share of global new orders was 63 percent [17]. The measure serves here to compare workload shares; outsourcing intensity and production depth differ too much across yards for it to compare labour productivity.
The market is highly concentrated and became so quickly. OECD reporting places China's share of global ship completions, measured in CGT, at 46.6 percent in 2022, against 9.1 percent in 2002. Over the same period, economies outside the OECD Council Working Party on Shipbuilding rose from 23.6 percent of global deliveries to 53.8 percent, and China's share of that non-member total rose from 38.5 to 86.6 percent [18]. Global new orders in 2025 came to 56.43 million CGT, of which Chinese yards took 63 percent and Korean yards 21 percent [17]. Concentration is the background condition. Four national positions reveal how market position and capability reproduction relate.
Japan offers the cost of rebuilding as quoted by the rebuilder. In December 2025 its Ministry of Land, Infrastructure, Transport and Tourism published a Shipbuilding Industry Revitalisation Roadmap that targets a doubling of annual construction volume, from roughly 9 million gross tons to 18 million by 2035, backed by public and private investment on the order of one trillion yen. The roadmap runs in three stages: automation and labour-saving equipment between 2026 and 2028, construction and expansion of production facilities from 2029 to 2031, and operation of expanded docks and cranes from 2032 to 2034 [19]. The sequence says more than the sums. Nine years, with robots first, docks second, and cranes and long-lead equipment third, is the time a rebuilder itself expects capability recovery to take. Automation comes ahead of physical plant because, in an economy with an ageing workforce and high wages, the labour to run an expanded yard is the scarcest input. The plan buys complements before it buys capacity, a pattern Section 9 returns to.
In the United States the carrier has gone. Announcing the findings of its Section 301 investigation in January 2025, the Office of the United States Trade Representative stated that the country ranks nineteenth in the world in commercial shipbuilding and builds fewer than five ships a year, against more than 1,700 in China; in 1975 the United States ranked first and built more than seventy ships annually [20]. The 1975 baseline is the analytically useful part. It records the disappearance of a capability carrier, the yards, suppliers and workforce that once built ships at scale, which is a different event from a decline in share.
Korea shows reproduction failing under a full order book, and in doing so it tests whether the framework depends on a fixed direction of strength. By competitive measures the industry is performing well. It holds a fifth of global new orders on a work-content basis, specialises in technically complex vessels and carries a large order book [17]. Capability reproduction in the skills dimension is under sustained pressure all the same.
Foreign workers have filled a rapidly growing share of the gap [21]. A separate shipbuilding quota under the E-9 non-professional employment visa ran from April 2023 to the end of 2025, with allocations of 5,000 places in 2024 and 2,500 in 2025, before shipbuilders returned to the general manufacturing quota [22]. Korean industrial research on demographic change and the shipbuilding workforce identifies skill transmission as a central constraint on the sector's capacity [23]. Reporting that draws on that work finds the age group declining most over the past eight years to be men aged 28 to 35, with workers aged 60 and over now outnumbering those under 27 [21]. The organisational form through which skill passed has weakened alongside. Apprenticeship under a foreman has become rare, and a welder with eighteen years in a subcontractor reports roughly one young worker per hundred. The top hourly wage he cites rose only from about 22,000 won in 2008 to 25,000 or 26,000 won, a fall in real terms, and 58.5 percent of new shipbuilding hires in 2024 left within their first year [21]. The researcher who led the Korean study adds that automation is hard in shipbuilding, so competitiveness rests in the end on people's skills [21].
The Korean case shows reproduction failing while competitive position holds, which makes reproduction an independent dimension, and it shows the response splitting into imported labour, automation and technological replacement. Imported labour can sustain output without restoring the local reproduction of skills, and it lets the location of production and the location of the resulting expenditure drift apart.
Yards also depend on engines, electrical systems, pumps, navigation equipment, control systems, software and specialised services. OECD analysis of the marine equipment industry shows shipbuilding capability distributed across this wider ecosystem, with important supply centres in Europe and East Asia [24]. A strategy focused on final assembly therefore overstates national capability. Shipbuilding here displays a general distinction between three layers of productive capacity: the physical plant, the intelligent and organisational capacity to design, integrate and maintain, and the control rights over the system. It explains why automation can ease shortages in welding, inspection and material handling while a missing supplier ecology, certification system or engineering organisation stays missing.
7 French Nuclear Construction: Reproduction Failing Through Interrupted Throughput
The Korean case shows reproduction failing for want of entrants. A second mechanism operates where entrants are available and the work itself stops. French nuclear construction documents it, and the diagnosis comes from a state-commissioned audit.
France's structural position in the sector never lapsed. It operates 57 reactors with about 63 gigawatts of capacity, and nuclear power supplied about 67 percent of its electricity generation in 2024 [25]. The design at issue was validated abroad while the domestic project struggled, as the audit commissioned by the government noted: commissioning and operation of the EPR units at Taishan in China had demonstrated the relevance of the reactor's concept and design [26]. Operating capability, engineering pedigree and market position all held.
Building capability did not. Construction of Flamanville 3 began in December 2007 on a fifty-four-month schedule at an estimated 3.3 billion euros [26]. In December 2022 EDF revised the estimated completion cost to 13.2 billion euros [27]. The unit achieved its first nuclear chain reaction on 3 September 2024, nearly seventeen years after construction began [28].
The report by Jean-Martin Folz, released by the Ministry of the Economy and Finance in October 2019, identified capability erosion as a major contributor to the delays, alongside deficiencies in early planning, project direction and coordination with suppliers. It found a generalised loss of industrial expertise in the sector and recommended that EDF work with the industry to improve training for workers, particularly welders [26]. The minister presenting the report stated that skills shortages were severe enough that most of the welding at Flamanville had to be performed by foreign subcontractors [26]. The audit also found insufficient detailed studies, incorrect technical references, and a loss of learning by doing in a supply chain that had been dormant for more than two decades [26].
The remedy names the mechanism. EDF's response included retraining, a dedicated welding plan and the creation, with industry partners, of the Hefaïs welding school in the Cotentin, whose first cohort was scheduled for September 2022 [29]. An industrial system that operates 57 reactors had to found a welding school before it could finish one more.
What the case establishes has limits worth marking. It leaves open the exact share of delay or cost attributable to capability erosion, and the audit itself names several contributing causes. Its theoretical function is narrower and firmer: it identifies interrupted throughput as a distinct mechanism that materially raises the difficulty of reconstruction. It also marks the limit of the technological shortcut. The design documentation survived and was validated in another country. What had to be rebuilt was the practised execution of welds to nuclear standard, together with the inspection and quality judgement that certify them. Codification cannot reach that layer, and automation substitutes for it only in part, because commissioning, maintenance and defect adjudication require people who understand the process being automated. When complementary assets of this kind have gone, both routes narrow at once. A system that has lost its welders cannot rebuild with people it does not have, and it cannot fully bypass them with machines that still need supervising.
Read together, the two cases show reproduction failing while position held, through mechanisms that call for different policies. In Korea the flow of work continued and the flow of entrants stopped, so the remedies are wages, training pipelines, visas and automation. In France the entrants were available and the flow of work stopped, so the remedy is throughput itself, a sequence of projects close enough together to keep practice, supplier qualification and quality assurance alive. Both turned to foreign labour for the same trade.
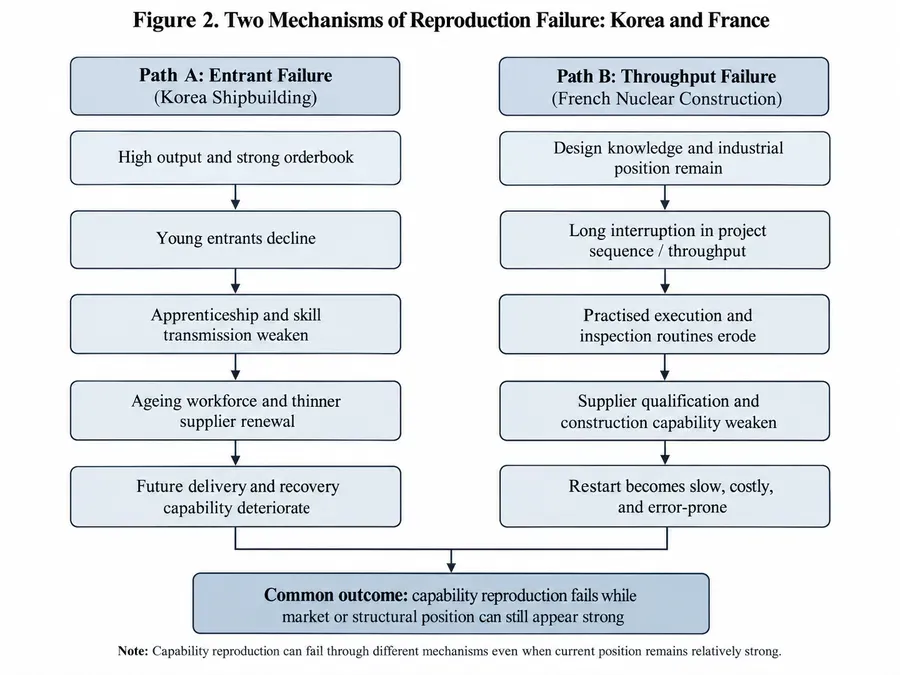
Figure 2. Two Mechanisms of Reproduction Failure: Korea and France
Japan's nine years and about one trillion yen, and France's seventeen years and roughly fourfold cost, are case-specific order-of-magnitude anchors for recovery. Their units of analysis differ, one a sectoral programme and the other a single project, so they form no common scale. Together they show capability recovery unfolding over fiscal cycles whichever mechanism caused the failure, and they set the baseline against which any claim about AI lowering recovery costs has to be judged.
8 The Recursive Rebuilding Bottleneck
As knowledge capabilities become easier to reproduce, scarcity migrates. Electricity, grid connections, advanced chips, robotics hardware, key materials, systems integrators, construction capacity, testing facilities and certification become the binding constraints, and they run on different clocks.
The gap between those clocks is documented. The International Energy Agency reports that planning, permitting and completing new grid infrastructure takes 5 to 15 years, while new build on the demand side is much faster, at 1 to 3 years for data centres [30]. Its survey of transmission supply chains found that average lead times for cables and large power transformers had almost doubled since 2021, reaching two to three years for cables and up to four years for transformers, with waits for some specialised direct-current cables extending beyond five years; cable prices have nearly doubled in real terms since 2019 [31]. Demand meanwhile moves on the fast clock. Global data centre electricity consumption is projected to more than double to roughly 945 terawatt hours by 2030, with AI the largest driver [32]. In the European Union, waits for a grid connection run from two to ten years depending on the country, and developers in the established data centre hubs face queues averaging seven to ten years [33].
Three structural gaps follow. Intelligent capability matures before the physical production system is ready to use it. A strategic vulnerability becomes politically visible before an alternative can be built. Policy changes within months, while skills, suppliers and infrastructure take years to recover. A fourth gap, between productive capacity and the social claims on its output, operates at the level of the whole economy.
Recovery also has a recursive structure. Building a factory requires grid equipment, industrial materials, construction firms, machine tools, engineers, testing services and finance. When those enabling capabilities have deteriorated too, a society must first restore the capacities required to restore capacity. The transmission equipment market illustrates the point: capital is available, and the binding inputs are specialised engineering talent, testing infrastructure, certification and materials [31].
Money can be committed in a year, while capability takes longer to produce. That asymmetry accounts for the long delays between the allocation of capital in large industrial programmes and the appearance of usable output.
9 AI as a Conditional Variable
9.1 A General-Purpose Technology With Uneven Complements
The economic significance of AI lies in its ability to enter many productive processes, from design, coding and research to supply-chain coordination, quality monitoring and work alongside machinery, so that once embedded it acts as a general productive input.
Economists call such an input a general-purpose technology, one with broad applicability, continuing technical improvement and a tendency to generate complementary innovations. Cockburn, Henderson and Stern argue that AI may become a general-purpose method of invention, changing the organisation and productivity of research itself [34]. Goldfarb, Taska and Teodoridis find that machine learning and related technologies diffuse in ways consistent with an emerging general-purpose technology [35]. Such technologies rarely produce immediate or evenly distributed effects. Firms must invest in data, software, complementary equipment, skills and new organisational routines, and Brynjolfsson, Rock and Syverson describe the period in which those complements are built as one explanation for the gap between rapid technical progress and slower measured productivity growth [36]. A model can be procured in a quarter; redesigning a production system around it takes years. Estimates of the aggregate macroeconomic effect remain wide [37].
In the sense used here, the age of artificial intelligence begins when AI and its complements change at once how capability is formed, which human tasks remain necessary, where production control resides, and how output is distributed and purchased.
9.2 Where the Returns to AI Land
The productivity literature established that general-purpose technologies deliver their gains only after complementary investment in data, equipment, skills and organisational routines [36]. That finding is usually read in time, as an account of why measured productivity lags technical progress. It can also be read in space. Where the complements are already in place, the technology converts into output quickly; where they are absent, the technology waits.
For industrial applications of AI the bundle of complementary assets is concrete. It consists of electricity at a workable price with a grid connection available on a workable schedule; robot bodies, and the domestic capacity to supply and service them; systems integrators who can put a cell into a line; materials and components within reach; an existing production base to apply the technology to; and the trades who install, commission and maintain the result. None of these is a model, and none can be procured on the timescale a model can.
The bundle is unevenly held, and its composition differs by would-be adopter. The International Federation of Robotics recorded 542,076 industrial robot installations worldwide in 2024. China accounted for 295,000 of them, or 54 percent, and its operational stock passed two million units [38]. For the first time Chinese manufacturers outsold foreign suppliers in their home market, raising their domestic share to 57 percent from about 28 percent a decade earlier [38]. That fact concerns the supply layer, since the equipment itself and the service network behind it are domestic. China's robot-density estimate was revised after manufacturing-employment data were updated, so absolute installations and domestic equipment supply are the relevant measures here [38]. Industrial electricity in 2024 cost roughly 0.082 euros per kilowatt hour in China, 0.199 in the European Union and 0.075 in the United States [39].
The positions therefore differ in composition. The European position is constrained on electricity price and on connection queues [33][39]. The Chinese position is strong on robot deployment and domestic equipment supply, with an industrial electricity price close to the American level. That strength stops at the production-control layer, where the export controls tightened by the United States in December 2024 apply to advanced computing and semiconductor manufacturing items [40].
The American position has price in its favour and three constraints of its own. The first is the grid's connection clock. At the end of 2024 about 2,300 gigawatts of generation and storage capacity was actively seeking connection to the United States transmission grid; for projects built between 2018 and 2024 the median time from interconnection request to commercial operation exceeded four years, up from under two years for projects built between 2000 and 2007; and only 13 percent of the capacity that requested interconnection between 2000 and 2019 had reached commercial operation by the end of 2024 [41]. The second is the skilled workforce. Deloitte and the Manufacturing Institute project that United States manufacturing could need as many as 3.8 million additional employees between 2024 and 2033, of whom about 1.9 million could go unfilled if skills and applicant gaps persist, [42]. The third constraint, systems-integrator capacity, has no national statistical series. The judgement here rests on the finding that integration is a gating step in robot adoption for smaller manufacturers [12], and the evidence supports it at that level of generality.
9.3 The Conditional Proposition
The resulting proposition is conditional and runs in two directions:
Where complementary assets are highly unequal and the missing capability is physical, control-related, or dependent on practised execution, AI is likely to widen industrial deployment and recovery gaps before narrowing them. Where the missing capability is primarily codified knowledge and the required complements are broadly accessible, AI can reduce those gaps.
Both halves matter, because together they let the proposition explain opposite outcomes. The technology that could in principle let a latecomer bypass accumulated industrial advantage requires, for deployment at scale, a good deal of what that advantage consists of. With the complements in place, AI compounds an existing position. Without them, it substitutes for the missing element only when that element is codified knowledge.
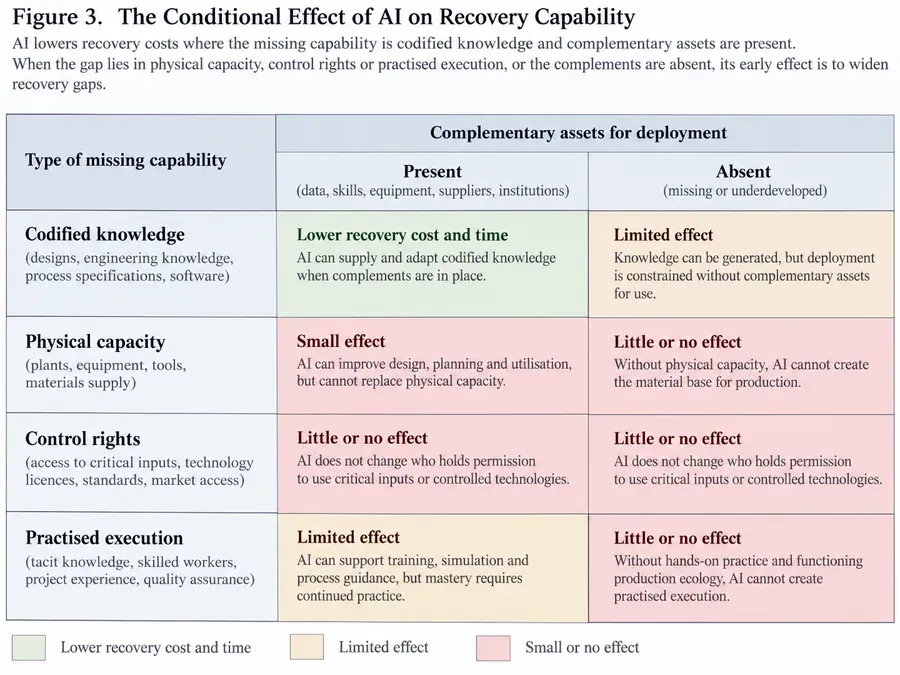
Figure 3. The Conditional Effect of AI on Recovery Capability
The control-rights row is identical across the two columns by design. The ordinary complement bundle leaves untouched the question of who holds the permissions. The complement that matters for this row is an alternative control architecture, open or domestically controlled, and only its presence moves the row.
The cases of Sections 6 and 7 sit on this matrix. Japan's roadmap addresses a gap in practised execution and labour with complements largely present, and it schedules automation first and physical capacity second. Flamanville's gap lay in practised execution with the design documentation already available, so AI's leverage there was small. Each gap type calls for its own remedy, and the matrix tells a policymaker which remedy AI can accelerate.
10 Three Routes to Recovery and Dynamic Irreversibility
Recovery can follow three routes, each serving a different objective. Same-paradigm restoration restarts similar equipment, rehires experienced workers, rebuilds former suppliers and returns to an established technical system. It is most feasible when dormant assets, organisational memory and supplier relationships have survived, and it preserves employment, accumulated knowledge and technological depth.
Cross-paradigm reconstruction restores an economic function through a different technical architecture, using AI-assisted engineering, flexible robotics, additive manufacturing, modular production or new materials to bypass parts of the older system. It matters most where recreating the former industrial ecology would be prohibitively expensive, and it may yield a more competitive system than the one it replaces. As Figure 3 shows, its feasibility depends on the category of the gap and on whether the complements are present where the rebuilding happens.
Functional recovery restores access to the required function without reproducing the original industry. Diversified imports, strategic inventories, substitute technology, localisation of critical components only, or emergency production capability can each deliver it, and it buys resilience at lower cost. Since the three routes buy different things, policy should specify which function it seeks to preserve before choosing among them.
Table 2. Three Routes to Recovery
| Recovery route | What is restored | Best suited to | Main requirement | Main risk |
|---|---|---|---|---|
| Same-paradigm restoration | former productive system | dormant carriers survive | retained assets and memory | high reconstruction cost |
| Cross-paradigm reconstruction | same function, new architecture | old ecology too costly | technology + complements | new control dependence |
| Functional recovery | access to function | full domestic reconstruction unnecessary | diversified access / inventories | capability remains external |
The irreversibility of erosion is therefore a variable. How irreversible a given erosion proves depends on whether new technology can bypass the link that was lost, and on whether the party attempting the bypass holds what the new technology needs. One form of dependency can also replace another. Recovery routed through proprietary models, restricted chips, licensed industrial software or external cloud platforms substitutes a control dependence for a capacity dependence. Judging such an exchange requires two questions: whether the acting party can operate, maintain and repair the new system itself, and whether the new dependence is as concentrated as the old.
11 Conclusion
Current productive capacity and recovery capability are two quantities, and industrial policy that measures only the first will be surprised by the second.
Capability is stored in codified knowledge, tacit judgement and physical and institutional carriers. Its reproduction can fail while market position holds, through a shortage of entrants, as in Korean shipbuilding, or through interrupted throughput, as in French nuclear construction. Wages, training pipelines and automation answer the first; a steady sequence of work answers the second. Recovery unfolds over fiscal cycles, and the equipment and skills that rebuilding requires are often scarce in their own right.
Artificial intelligence changes the feasibility of recovery, and it does so unevenly. It shortens the road back where the gap is codified knowledge and the complements are in place. Elsewhere, historical industrial ecology continues to decide who can build, and early deployment advantages accrue to those who already hold the complements.
Two results carry beyond the cases. The four-way classification of gaps tells a policymaker which remedy artificial intelligence can accelerate, and the recovery timescale tells a government how long a reshoring or de-risking programme must be sustained before it yields usable capacity. Both argue for measuring the carriers of capability directly, well before a crisis exposes their absence.
References
[1] Arrow, Kenneth J. "The Economic Implications of Learning by Doing." Review of Economic Studies 29, no. 3 (1962): 155–173.
[2] Nelson, Richard R., and Sidney G. Winter. An Evolutionary Theory of Economic Change. Cambridge, MA: Belknap Press of Harvard University Press, 1982.
[3] Cohen, Wesley M., and Daniel A. Levinthal. "Absorptive Capacity: A New Perspective on Learning and Innovation." Administrative Science Quarterly 35, no. 1 (1990): 128–152.
[4] Teece, David J., Gary Pisano, and Amy Shuen. "Dynamic Capabilities and Strategic Management." Strategic Management Journal 18, no. 7 (1997): 509–533.
[5] David, Paul A. "Clio and the Economics of QWERTY." American Economic Review 75, no. 2 (1985): 332–337.
[6] Pisano, Gary P., and Willy C. Shih. "Restoring American Competitiveness." Harvard Business Review 87, nos. 7–8 (2009): 114–125.
[7] Lundvall, Bengt-Åke, ed. National Systems of Innovation: Towards a Theory of Innovation and Interactive Learning. London: Pinter, 1992.
[8] Malerba, Franco. "Sectoral Systems of Innovation and Production." Research Policy 31, no. 2 (2002): 247–264.
[9] Polanyi, Michael. The Tacit Dimension. Garden City, NY: Doubleday, 1966.
[10] Lave, Jean, and Etienne Wenger. Situated Learning: Legitimate Peripheral Participation. Cambridge: Cambridge University Press, 1991.
[11] Falco, Joseph A., Karl Van Wyk, and Kenneth Kimble. "Advances in Robot Technology Supporting Low-Volume/High-Mix Small Part Assembly Operations." In Recent Advances in Industrial Robotics. Hackensack, NJ: World Scientific, 2022. National Institute of Standards and Technology author manuscript, https://tsapps.nist.gov/publication/get_pdf.cfm?pub_id=926435.
[12] Marvel, Jeremy A., Roger Bostelman, and Joseph Falco. Best Practices for the Integration of Collaborative Robots into Workcells Within Small and Medium-Sized Manufacturing Operations. NIST Advanced Manufacturing Series 100-41. Gaithersburg, MD: National Institute of Standards and Technology, 2021. https://doi.org/10.6028/NIST.AMS.100-41.
[13] Association for Advancing Automation. "Robot Orders Grow 6.6% in 2025 as General Industries Drive Broader Automation Adoption." Ann Arbor, MI, 4 February 2026. https://www.automate.org/robotics/industry-statistics/robot-orders-grow-6-6-in-2025-as-general-industries-drive-broader-automation-adoption.
[14] Dixit, Avinash K., and Robert S. Pindyck. Investment under Uncertainty. Princeton, NJ: Princeton University Press, 1994.
[15] Organisation for Economic Co-operation and Development, Council Working Party on Shipbuilding. A New Compensated Gross Ton (CGT) System. C/WP6(2006)7. Paris: OECD.
[16] Xinhua News Agency. "China's Shipbuilding Keeps Global Lead in International Market Share in 2025" [in Chinese], reporting data released by the Ministry of Industry and Information Technology on 1 February 2026. 2 February 2026. https://www.news.cn/photo/20260202/95b3266fb9484913a9ed1f0b4d89e2b0/c.html.
[17] Oh, Jieun. "Korean Shipbuilders Secure 18% of Orders Last Month… Annual Chinese Volume Drops Sharply." Asia Business Daily, 7 January 2026, reporting Clarksons Research data. https://www.asiae.co.kr/en/article/2026010709203304033.
[18] Organisation for Economic Co-operation and Development, Council Working Party on Shipbuilding. Policy and Market Developments in Non-WP6 Economies. C/WP6(2023)3/FINAL. Paris: OECD, 2023.
[19] Ministry of Land, Infrastructure, Transport and Tourism, Japan. Shipbuilding Industry Revitalisation Roadmap [in Japanese]. Tokyo, 26 December 2025. https://www.mlit.go.jp/maritime/content/001975728.pdf.
[20] Office of the United States Trade Representative. Report on China's Targeting of the Maritime, Logistics, and Shipbuilding Sectors for Dominance, with press release on the Section 301 findings. Washington, DC: USTR, 16 January 2025.
[21] Seo, Mid-eum. "Hourly Pay Still Around 20,000 Won after 18 Years: 'Who Would Work Here?' Plenty of Orders, but No Workers" [in Korean], in K-Shipbuilding: The Disappearing Skilled Workforce, part 1. Asia Business Daily, 10 June 2026; updated 11 June 2026. https://www.asiae.co.kr/article/2026060915251603914.
[22] Ministry of Employment and Labor, Republic of Korea. "Shipbuilding Can Continue to Use Foreign Workers through the Integrated Manufacturing Quota" [in Korean]. Explanatory press release, 23 December 2025. https://www.moel.go.kr/news/enews/explain/enewsView.do?news_seq=18776.
[23] Lee, Eun-chang, and Eun-seon Gil. Workforce Impacts on the Shipbuilding Industry from Demographic Change and the Digital and AI Transition, and Response Measures [in Korean]. KIET Policy Materials. Sejong: Korea Institute for Industrial Economics and Trade, 31 December 2025. https://www.kiet.re.kr/research/podataView?podata_no=379.
[24] Organisation for Economic Co-operation and Development. Analysis of the Marine Equipment Industry and Its Challenges. C/WP6(2022)15/FINAL. Paris: OECD, 2022.
[25] World Nuclear Association. "Nuclear Power in France." Country profile, updated 1 April 2026. https://world-nuclear.org/Information-Library/Country-Profiles/countries-A-F/France.
[26] Folz, Jean-Martin. La construction de l'EPR de Flamanville: Rapport au Président-Directeur Général d'EDF. Paris: Ministère de l'Économie et des Finances, October 2019; released 28 October 2019. https://presse.economie.gouv.fr/1505-rapport-de-jean-martin-folz-la-construction-de-lepr-de-flamanville/.
[27] Électricité de France. "Update on the Flamanville EPR." Press release, 16 December 2022. https://www.edf.fr/en/the-edf-group/dedicated-sections/journalists/all-press-releases/update-on-the-flamanville-epr-0.
[28] Électricité de France. "Update on the Flamanville EPR: The Reactor Produces Its First Electrons on the National Electricity Grid." Press release, 21 December 2024. https://www.edf.fr/en/the-edf-group/dedicated-sections/journalists/all-press-releases/update-on-the-flamanville-epr-the-reactor-produces-its-first-electrons-on-the-national-electricity-grid.
[29] Électricité de France and Groupement des Industriels Français de l'Énergie Nucléaire. "At the Midpoint of the Excell Plan, EDF and the Nuclear Industry Present Concrete Results and New Commitments for 2022" [in French]. Press release, 8 November 2021. https://www.edf.fr/sites/groupe/files/epresspack/1835/3569ad2b4b3cc7102b7bedbf99012c7f.pdf.
[30] International Energy Agency. Electricity 2026, Grids chapter. Paris: IEA, 2026.
[31] International Energy Agency. Building the Future Transmission Grid: Strategies to Navigate Supply Chain Challenges. Paris: IEA, 2025.
[32] International Energy Agency. Energy and AI. Paris: IEA, 2025.
[33] International Energy Agency. "Overcoming Energy Constraints Is Key to Delivering on Europe's Data Centre Goals." Commentary, 16 November 2025. Paris: IEA. https://www.iea.org/commentaries/overcoming-energy-constraints-is-key-to-delivering-on-europe-s-data-centre-goals.
[34] Cockburn, Iain M., Rebecca Henderson, and Scott Stern. "The Impact of Artificial Intelligence on Innovation: An Exploratory Analysis." NBER Working Paper No. 24449. Cambridge, MA: National Bureau of Economic Research, 2018.
[35] Goldfarb, Avi, Bledi Taska, and Florenta Teodoridis. "Could Machine Learning Be a General Purpose Technology? A Comparison of Emerging Technologies Using Data from Online Job Postings." NBER Working Paper No. 29767. Cambridge, MA: National Bureau of Economic Research, 2022.
[36] Brynjolfsson, Erik, Daniel Rock, and Chad Syverson. "Artificial Intelligence and the Modern Productivity Paradox: A Clash of Expectations and Statistics." NBER Working Paper No. 24001. Cambridge, MA: National Bureau of Economic Research, 2017.
[37] Acemoglu, Daron. The Simple Macroeconomics of AI. NBER Working Paper No. 32487. Cambridge, MA: National Bureau of Economic Research, 2024.
[38] International Federation of Robotics. World Robotics 2025: Industrial Robots. Frankfurt: IFR, 2025. Press release: "Global Robot Demand in Factories Doubles Over 10 Years," Frankfurt, 25 September 2025. https://ifr.org/news/global-robot-demand-in-factories-doubles-over-10-years/.
[39] BusinessEurope. "High Cost of Energy." Data Hub, based on Eurostat data. Brussels, 2025. https://www.businesseurope.eu/media-room/data-hub/high-cost-of-energy/.
[40] U.S. Department of Commerce, Bureau of Industry and Security. Foreign-Produced Direct Product Rule Additions, and Refinements to Controls for Advanced Computing and Semiconductor Manufacturing Items. Interim final rule. 89 Federal Register 96790, 5 December 2024; effective 2 December 2024.
[41] Rand, Joseph, Nick Manderlink, Steven Zhang, Chris Talley, Will Gorman, Ryan Wiser, Joachim Seel, Julie Mulvaney Kemp, Seongeun Jeong, and Fritz Kahrl. Queued Up: 2025 Edition, Characteristics of Power Plants Seeking Transmission Interconnection as of the End of 2024. Berkeley, CA: Lawrence Berkeley National Laboratory, December 2025. https://emp.lbl.gov/publications/queued-2025-edition-characteristics.
[42] Deloitte and The Manufacturing Institute. Taking Charge: Manufacturers Support Growth with Active Workforce Strategies. April 2024. Press release: "US Manufacturing Could Need as Many as 3.8 Million New Employees by 2033," New York, 3 April 2024. https://www2.deloitte.com/us/en/pages/about-deloitte/articles/press-releases/us-manufacturing-could-need-new-employees-by-2033.html.
Authors

Alex is the founder of the Terawatt Times Institute, developing cognitive-structural frameworks for AI, energy transitions, and societal change. His work examines how emerging technologies reshape political behavior and civilizational stability.

Hiroto Nakamura is a research fellow focused on climate intelligence, satellite-based MRV, and AI-driven environmental monitoring. He analyzes geospatial data and verification systems to improve global carbon transparency and emissions accountability

Caroline is a Houston-born analyst focusing on Gulf Coast oil, LNG, and industrial electrification. She studies how legacy energy systems and new clean-power infrastructure reshape the economic future of the American South.